Answered step by step
Verified Expert Solution
Link Copied!

Question

1 Approved Answer

1. Calculate the frequency distribution for each variable in the data file. Examine the distribution to get a feel for the data. 1.) The response
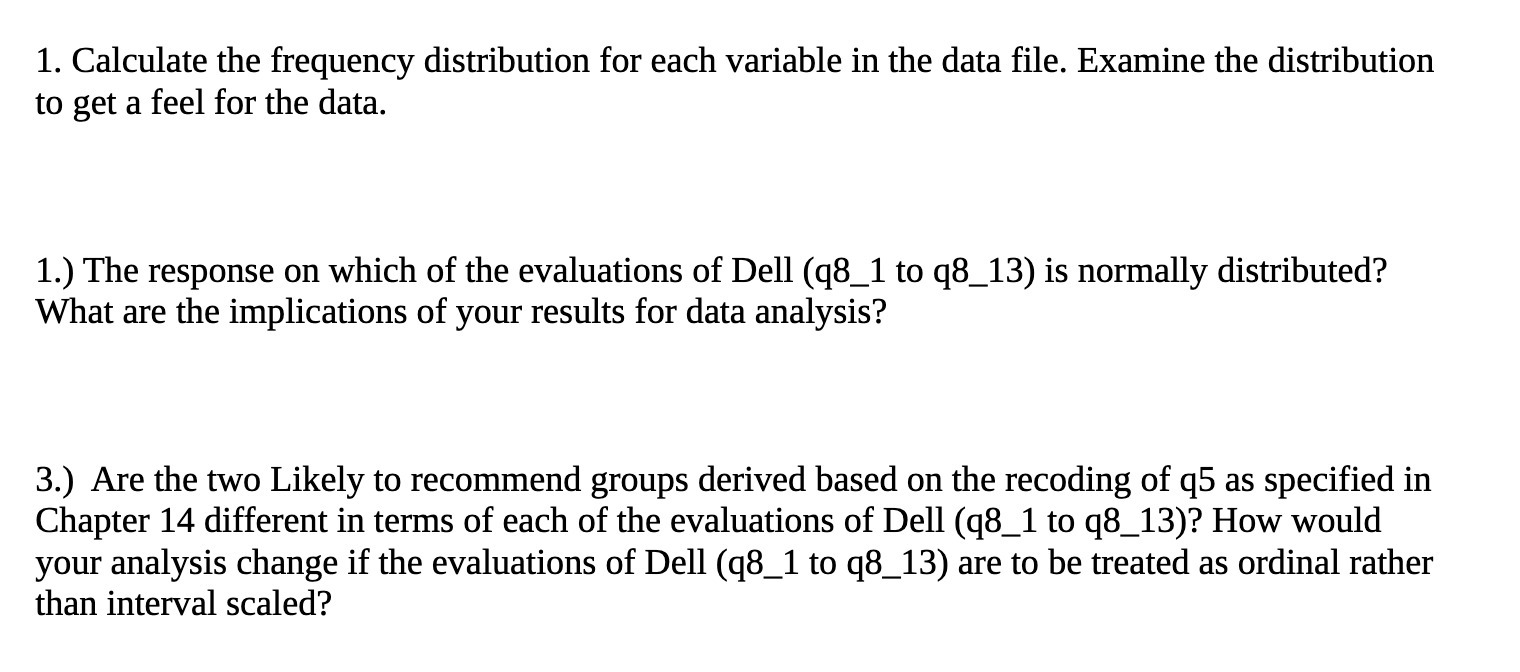
image text in transcribed
1. Calculate the frequency distribution for each variable in the data file. Examine the distribution to get a feel for the data. 1.) The response on which of the evaluations of Dell (q8_1 to q8_13) is normally distributed? What are the implications of your results for data analysis? 3.) Are the two Likely to recommend groups derived based on the recoding of (15 as specified in Chapter 14 different in terms of each of the evaluations of Dell (q8_1 to q8_13)? How would your analysis change if the evaluations of Dell (q8_1 t0 q8_13) are to be treated as ordinal rather than interval scaled

Step by Step Solution

There are 3 Steps involved in it

Step: 1

blur-text-image

Get Instant Access to Expert-Tailored Solutions

See step-by-step solutions with expert insights and AI powered tools for academic success

Step: 2

blur-text-image

Step: 3

blur-text-image

Ace Your Homework with AI

Get the answers you need in no time with our AI-driven, step-by-step assistance

Get Started

Recommended Textbook for

Marketing Mistakes And Successes

Authors: James F. Dartley

11th Edition

978-0470169810, 0470169818

More Books

Students also viewed these Marketing questions