

Answered step by step
Verified Expert Solution
Question
1 Approved Answer
1) Calculate the liquidity, leverage, turnover, profitability, and market value ratios for the fiscal year 2019. IN CASE: You can zoom into the numbers to
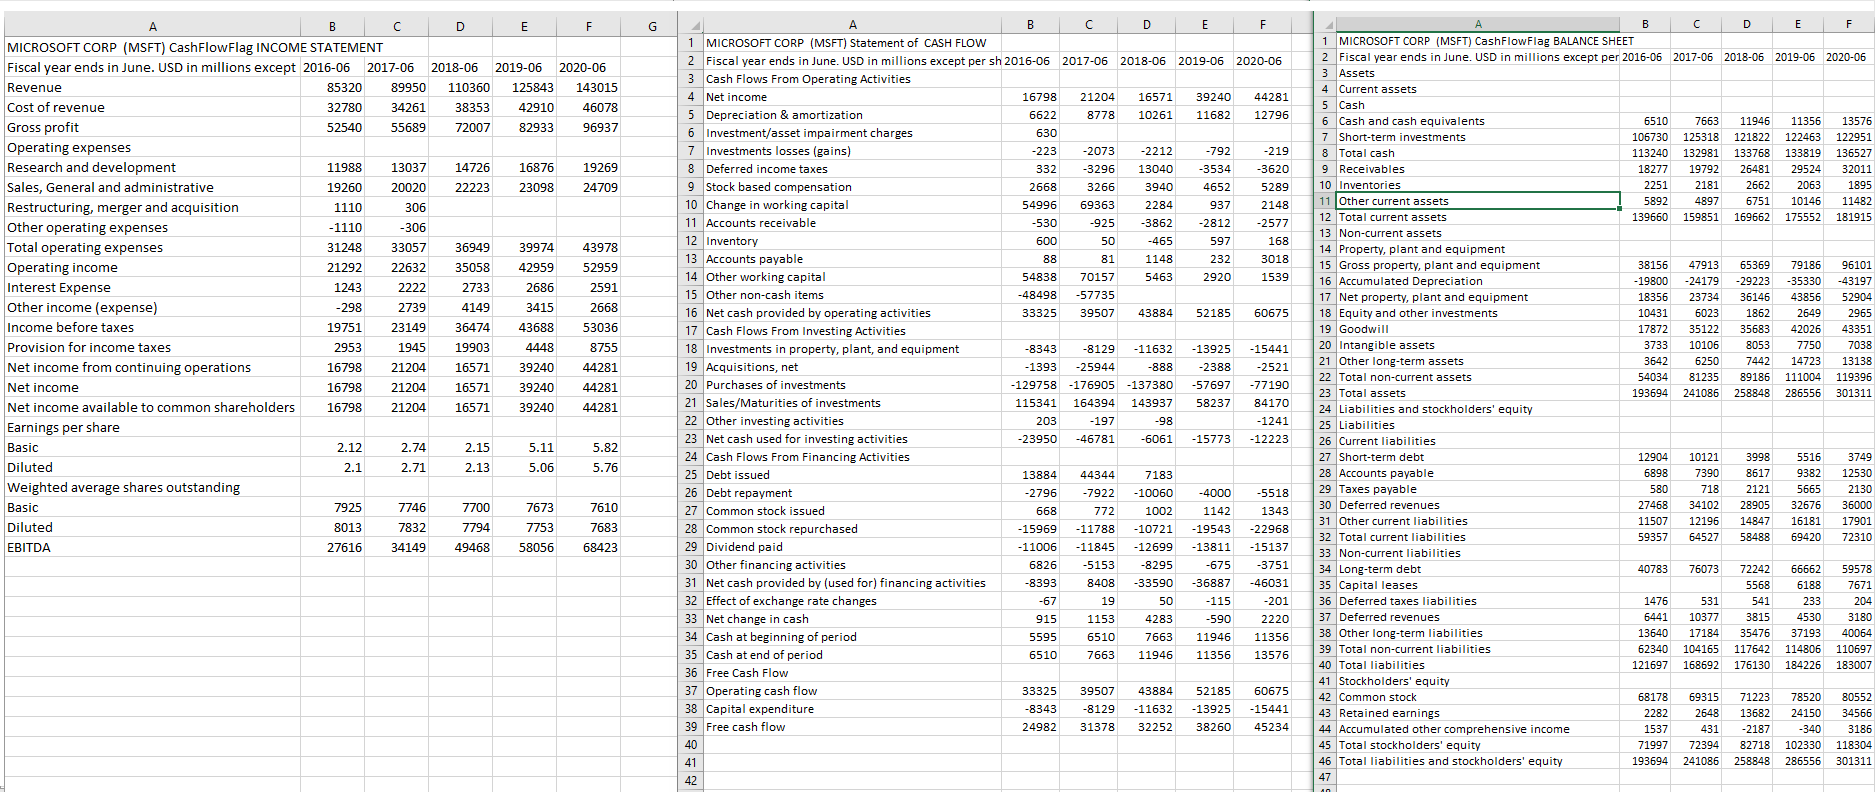 1) Calculate the liquidity, leverage, turnover, profitability, and market value ratios for the fiscal year 2019.
IN CASE: You can zoom into the numbers to get a clearer view.
G & Total cash -3534 2662 1110 A B D E F MICROSOFT CORP (MSFT) CashFlowFlag INCOME STATEMENT Fiscal year ends in June. USD in millions except 2016-06 2017-06 2018-06 2019-06 2020-06 Revenue 85320 89950 110360 125843 143015 Cost of revenue 32780 34261 38353 42910 46078 Gross profit 52540 55689 72007 82933 96937 Operating expenses Research and development 11988 13037 14726 16876 19269 Sales, General and administrative 19260 20020 22223 23098 24709 Restructuring, merger and acquisition 306 Other operating expenses - 1110 -306 Total operating expenses 31248 33057 36949 39974 43978 Operating income 21292 22632 35058 42959 52959 Interest Expense 1243 2222 2733 2686 2591 Other income (expense) -298 2739 4149 3415 2668 Income before taxes 19751 23149 36474 43688 53036 Provision for income taxes 2953 1945 19903 4448 8755 Net income from continuing operations 16798 21204 16571 39240 44281 Net income 16798 21204 16571 39240 44281 Net income available to common shareholders 16798 21204 16571 39240 44281 Earnings per share Basic 2.12 2.74 2.15 5.11 5.82 Diluted 2.1 2.71 2.13 5.06 5.76 Weighted average shares outstanding Basic 7925 7746 7700 7673 7610 Diluted 8013 7832 7794 7753 7683 EBITDA 27616 34149 49468 58056 68423 -29223 18356 52904 35683 30 Intangible assets 22 Total non-current assets B D E F 1 MICROSOFT CORP (MSFT) Statement of CASH FLOW 2 Fiscal year ends in June. USD in millions except per sh 2016-06 2017-06 2018-06 2019-06 2020-06 3 Cash Flows From Operating Activities 4 Net income 16798 21204 16571 39240 44281 5 Depreciation & amortization 6622 8778 10261 11682 12796 6 Investment/asset impairment charges 630 7 Investments losses (gains) -223 -2073 -2212 -792 -219 8 Deferred income taxes 332 -3296 13040 -3620 9 Stock based compensation 2668 3266 3940 4652 5289 10 Change in working capital 54996 69363 2284 937 2148 11 Accounts receivable -530 -925 -3862 -2812 -2577 12 Inventory 600 50 -465 597 168 13 Accounts payable 88 81 1148 232 3018 14 Other working capital 54838 70157 5463 2920 1539 15 Other non-cash items -48498 -57735 16 Net cash provided by operating activities 33325 39507 43884 52185 60675 17 Cash Flows From Investing Activities 18 Investments in property, plant, and equipment -8343 -8129 -11632 -13925 -15441 19 Acquisitions, net -1393 -25944 -888 -2388 -2521 20 Purchases of investments -129758 -176905 -137380 -57697 -77190 21 Sales/Maturities of investments 115341 164394 143937 58237 84170 22 Other investing activities 203 -197 -98 -1241 23 Net cash used for investing activities -23950 -46781 -6061 -15773 -12223 24 Cash Flows From Financing Activities 25 Debt issued 13884 44344 7183 26 Debt repayment -2796 -7922 -10060 -4000 -5518 27 Common stock issued 668 772 1002 1142 1343 28 Common stock repurchased -15969 -11788 -10721 -19543 -22968 29 Dividend paid -11006 -11845 -12699 -13811 -15137 30 Other financing activities -5153 -8295 -675 -3751 31 Net cash provided by (used for) financing activities -8393 8408 -33590 -36887 -46031 32 Effect of exchange rate changes -67 19 50 -115 -201 33 Net change in cash 915 1153 4283 -590 2220 34 Cash at beginning of period 5595 6510 11946 11356 35 Cash at end of period 6510 7663 11946 11356 13576 36 Free Cash Flow 37 Operating cash flow 33325 39507 43884 52185 60675 38 Capital expenditure -8343 -8129 -11632 -13925 -15441 39 Free cash flow 24982 31378 32252 38260 45234 40 41 B D E F 1 MICROSOFT CORP (MSFT) CashflowFlag BALANCE SHEET 2 Fiscal year ends in June. USD in millions except per 2016-06 2017-06 2018-06 2019-06 2020-06 Assets Current Current assets Cach Cash 6 Cash and cash equivalents 6510 7663 11946 11356 13576 7 Short-term investments 106730 125318 121822 122463 122951 8 Total 113240 132981 133768 133819 136527 9 Receivables 18277 19792 26481 29524 10 inventories 32011 10 Inventories 2251 2181 2063 1895 11 Other current assets 5892 4897 6751 10146 11482 12 Total current assets 139660 159851 169662 175552 181915 13 Non-current assets 14 Property, plant and equipment 15 Gross property, plant and equipment 38156 47913 65369 79186 96101 16 Accumulated Depreciation -19800 -24179 -35330 -43197 17 Net property, plant and equipment 23734 36146 43856 18 Equity and other investments 10431 6023 1862 1862 2649 2965 19 Goodwill 17872 17872 35122 42026 43351 20 3733 10106 8053 7750 7038 21 Other 21 Other long-term assets 3642 6250 7442 14723 13138 22 Total 54034 81235 89186 111004 119396 193694 241086 258848 301311 24 Liabilities and stockholders' equity 25 Liabilities 26 Current liabilities 27 Short-term debt 12904 10121 3998 5516 3749 28 Accounts payable 6898 7390 8617 9382 12530 Taxes payable 580 718 2121 5665 2130 30 Deferred revenues 27468 34102 28905 32676 36000 31 Other current liabilities 11507 12196 14847 16181 17901 32 Total current liabilities 59357 64527 58488 69420 72310 33 Non-current liabilities mens 40783 76073 72242 66662 59578 35 Capital leases 5568 6188 7671 36 Deferred taxes liabilities 1476 531 541 233 204 37 Deferred revenues 6441 10377 3815 4530 3180 38 Other long-term liabilities 13640 17184 35476 37193 40064 39 Total non-current liabilities 62340 104165 117642 114806 110697 40 Total liabilities 121697 168692 176130 184226 183007 41 Stockholders' equity new 42 Common stock 68178 69315 71223 78520 80552 43 Retained earnings 2282 2648 13682 24150 34566 44 Accumulated other comprehensive income 1537 431 -2187 -340 3186 45 Total stockholders' equity 71997 72394 82718 102330 118304 46 Total liabilities and stockholders' equity 193694 241086 258848 286556 301311 47 286556 23 Total assets 6826 34 Long-term debt 7663 42Step by Step Solution
There are 3 Steps involved in it
Step: 1

Get Instant Access to Expert-Tailored Solutions
See step-by-step solutions with expert insights and AI powered tools for academic success
Step: 2

Step: 3
Ace Your Homework with AI
Get the answers you need in no time with our AI-driven, step-by-step assistance
Get Started
Digital Currencies
Authors: Santiago Trevey
1st Edition
979-8353712886