Question
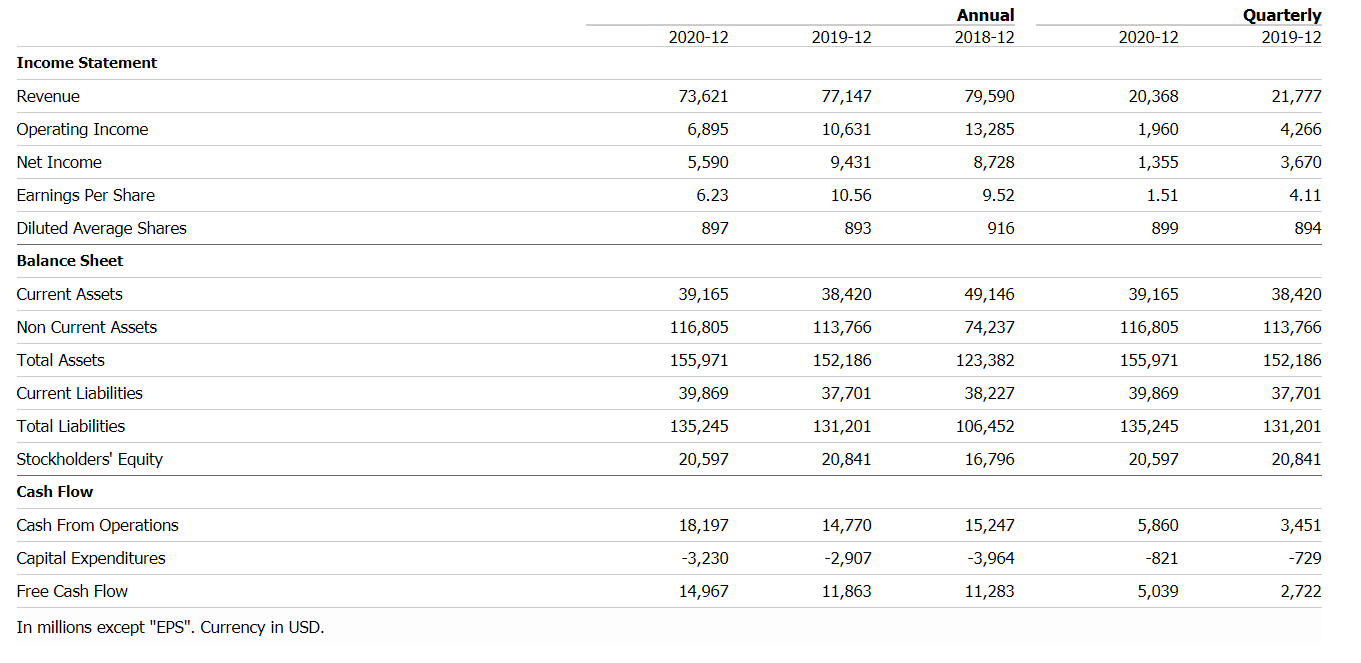
1) Calculate the liquidity, leverage, turnover, profitability, and market value ratios for the most recent two years (check the fiscal year and month.). In total,

1) Calculate the liquidity, leverage, turnover, profitability, and market value ratios for the most recent two years (check the fiscal year and month.). In total, you should calculate 20 (ratios) x 2 (years) = 40 ratios. Please use the basic shares.
2) After calculating all the ratios, please decompose the companys profitability over the two years using the Dupont analysis. Explain the composition of the profitability for your company. Has each component of Dupont increased or decreased from the previous year? How has that affected the companys overall profitability? Is there room for improvements?
Annual 2018-12 Quarterly 2019-12 2020-12 2019-12 2020-12 Income Statement Revenue 73,621 77,147 79,590 20,368 21,777 Operating Income 6,895 10,631 13,285 1,960 4,266 Net Income 5,590 9,431 8,728 1,355 3,670 Earnings Per Share 6.23 10.56 9.52 1.51 4.11 Diluted Average Shares 897 893 916 899 894 Balance Sheet Current Assets 39,165 38,420 49,146 38,420 Non Current Assets 74,237 116,805 155,971 113,766 152,186 39,165 116,805 155,971 39,869 Total Assets 123,382 113,766 152,186 37,701 Current Liabilities 39,869 37,701 38,227 Total Liabilities 131,201 106,452 135,245 131,201 135,245 20,597 Stockholders' Equity 20,841 16,796 20,597 20,841 Cash Flow Cash From Operations 18,197 14,770 15,247 5,860 3,451 Capital Expenditures -2,907 -3,964 -821 -729 -3,230 14,967 Free Cash Flow 11,863 11,283 5,039 2,722 In millions except "EPS". Currency in USD. Annual 2018-12 Quarterly 2019-12 2020-12 2019-12 2020-12 Income Statement Revenue 73,621 77,147 79,590 20,368 21,777 Operating Income 6,895 10,631 13,285 1,960 4,266 Net Income 5,590 9,431 8,728 1,355 3,670 Earnings Per Share 6.23 10.56 9.52 1.51 4.11 Diluted Average Shares 897 893 916 899 894 Balance Sheet Current Assets 39,165 38,420 49,146 38,420 Non Current Assets 74,237 116,805 155,971 113,766 152,186 39,165 116,805 155,971 39,869 Total Assets 123,382 113,766 152,186 37,701 Current Liabilities 39,869 37,701 38,227 Total Liabilities 131,201 106,452 135,245 131,201 135,245 20,597 Stockholders' Equity 20,841 16,796 20,597 20,841 Cash Flow Cash From Operations 18,197 14,770 15,247 5,860 3,451 Capital Expenditures -2,907 -3,964 -821 -729 -3,230 14,967 Free Cash Flow 11,863 11,283 5,039 2,722 In millions except "EPS". Currency in USDStep by Step Solution
There are 3 Steps involved in it
Step: 1

Get Instant Access to Expert-Tailored Solutions
See step-by-step solutions with expert insights and AI powered tools for academic success
Step: 2

Step: 3

Ace Your Homework with AI
Get the answers you need in no time with our AI-driven, step-by-step assistance
Get Started


