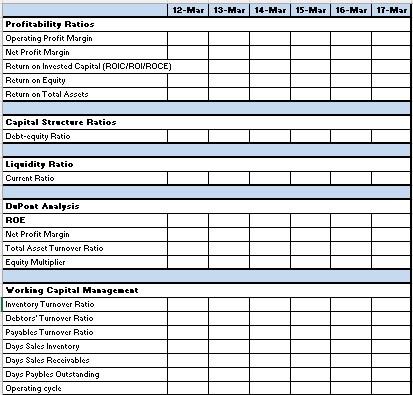
1. Calculate the profitability, capital structure, liquidity, DuPont, and working capital management ratios that are in the ratio tab in the excel template uploaded on Moodle. Use the balance sheet and income state in the excel file for the inputs for these ratios. This should cover the years 2012 to 2017.
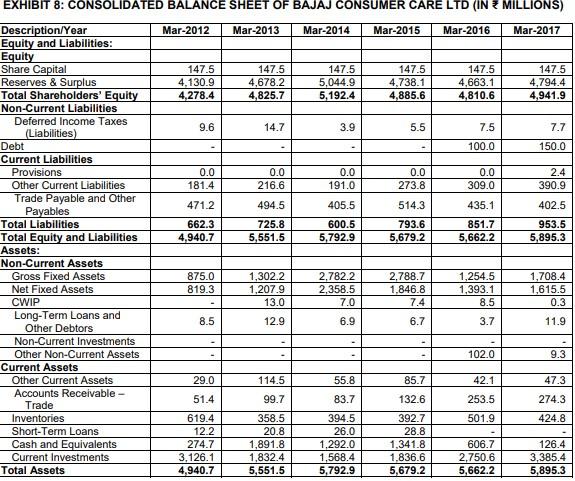
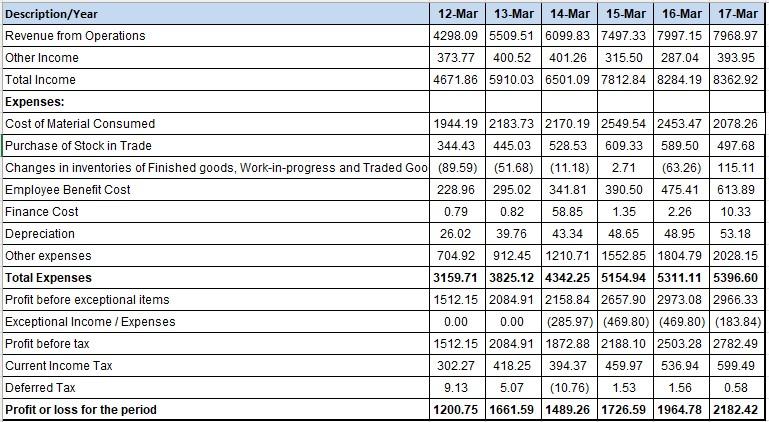
Balance sheet
Income statement
Ratios
0.0 lolo EXHIBIT 8: CONSOLIDATED BALANCE SHEET OF BAJAJ CONSUMER CARE LTD (IN MILLIONS) Description/Year Mar-2012 Mar-2013 Mar-2014 Mar-2015 Mar-2016 Mar-2017 Equity and Liabilities: Equity Share Capital 147.5 147.5 147.5 147.5 147.5 147.5 Reserves & Surplus 4.130.9 4,678.2 5,044.9 4,738.1 4,663.1 4,794.4 Total Shareholders' Equity 4,278.4 4,825.7 5,192.4 4,885.6 4,810.6 4,941.9 Non-Current Liabilities Deferred Income Taxes 9.6 14.7 3.9 5.5 7.5 7.7 (Liabilities) Debt 100.0 150.0 Current Liabilities Provisions 0.0 0.0 0.0 0.0 2.4 Other Current Liabilities 181.4 216.6 191.0 273.8 309.0 390.9 Trade Payable and Other 471.2 494.5 405.5 514.3 435.1 402.5 Payables Total Liabilities 662.3 725.8 600.5 793.6 851.7 953.5 Total Equity and Liabilities 4,940.7 5,551.5 5,792.9 5,679.2 5,662.2 5,895.3 Assets: Non-Current Assets Gross Fixed Assets 875.0 1,302.2 2.782.2 2,788.7 1,254.5 1,708.4 Net Fixed Assets 819.3 1,207.9 2,358.5 1.846.8 1,393.1 1,615.5 CWIP 13.0 7.0 7.4 8.5 0.3 Long-Term Loans and 8.5 12.9 6.9 6.7 3.7 11.9 Other Debtors Non-Current Investments Other Non-Current Assets 102.0 9.3 Current Assets Other Current Assets 29.0 114.5 55.8 85.7 42.1 47.3 Accounts Receivable - 51.4 99.7 83.7 132.6 253.5 274.3 Trade Inventories 619.4 358.5 394.5 392.7 501.9 424.8 Short-Term Loans 12.2 20.8 26.0 28.8 Cash and Equivalents 274.7 1,891.8 1.292.0 1,341.8 606.7 126.4 Current Investments 3,126.1 1,832.4 1,568.4 1.836.6 2,750.6 3,385.4 Total Assets 4,940.7 5,551.5 5,792.9 5,679.2 5,662.2 5,895.3 Description/Year 12-Mar 13-Mar 14-Mar 15-Mar 16-Mar 17-Mar Revenue from Operations 4298.09 5509.51 6099.83 7497.33 7997.15 7968.97 Other Income 373.77 400.52 401.26 315.50 287.04 393.95 Total Income 4671.86 5910.03 6501.09 7812.84 8284.198362.92 Expenses: Cost of Material Consumed 1944.19 2183.73 2170.19 2549.54 2453.47 2078.26 Purchase of Stock in Trade 344.43 445.03 528.53 609.33 589.50 497.68 Changes in inventories of Finished goods, Work-in-progress and Traded Goo (89.59) (51.68) (11.18) 2.71 (63.26) 115.11 Employee Benefit Cost 228.96 295.02 341.81 390.50 475.41 613.89 Finance Cost 0.79 0.82 58.85 1.35 2.26 10.33 Depreciation 26.02 39.76 43.34 48.65 48.95 53.18 Other expenses 704.92 912.45 1210.71 1552.85 1804.79 2028.15 Total Expenses 3159.71 3825.12 4342.25 5154.94 5311.11 5396.60 Profit before exceptional items 1512.15 2084.91 2158.84 2657.90 2973.08 2966.33 Exceptional Income / Expenses 0.00 0.00 (285.97) (469.80) (469.80)|(183.84) Profit before tax 1512.15 2084.91 1872.88 2188.10 2503.28 2782.49 Current Income Tax 302.27 418.25 394.37 459.97 536.94 599.49 Deferred Tax 9.13 5.07 (10.76) 1.53 1.56 0.58 Profit or loss for the period 1200.75 1661.59 1489.26 1726.59 1964.78 2182.42 12-Har 13-Har 14-Har 15-Har 16-Har 17-Har Profitability Ratios Operating Profit Margin Net Profit Margin Return on invested Capital (ROIC/RO/ROCE) Return on Equity Return on Total Assets Capital Structure Ratios Debt-equity Ratio Liquidity Ratio Current Ratio DuPont Analysis ROE Net Profit Margin Total Asset Turnover Ratio Equity Multiplier Yorking Capital Management Inventory Turnover Ratio Debtors' Turnover Ratio Payable Turnover Ratio Days Sales Inventory Days Sales Receivables Days Paybles Outstanding Operating cycle 0.0 lolo EXHIBIT 8: CONSOLIDATED BALANCE SHEET OF BAJAJ CONSUMER CARE LTD (IN MILLIONS) Description/Year Mar-2012 Mar-2013 Mar-2014 Mar-2015 Mar-2016 Mar-2017 Equity and Liabilities: Equity Share Capital 147.5 147.5 147.5 147.5 147.5 147.5 Reserves & Surplus 4.130.9 4,678.2 5,044.9 4,738.1 4,663.1 4,794.4 Total Shareholders' Equity 4,278.4 4,825.7 5,192.4 4,885.6 4,810.6 4,941.9 Non-Current Liabilities Deferred Income Taxes 9.6 14.7 3.9 5.5 7.5 7.7 (Liabilities) Debt 100.0 150.0 Current Liabilities Provisions 0.0 0.0 0.0 0.0 2.4 Other Current Liabilities 181.4 216.6 191.0 273.8 309.0 390.9 Trade Payable and Other 471.2 494.5 405.5 514.3 435.1 402.5 Payables Total Liabilities 662.3 725.8 600.5 793.6 851.7 953.5 Total Equity and Liabilities 4,940.7 5,551.5 5,792.9 5,679.2 5,662.2 5,895.3 Assets: Non-Current Assets Gross Fixed Assets 875.0 1,302.2 2.782.2 2,788.7 1,254.5 1,708.4 Net Fixed Assets 819.3 1,207.9 2,358.5 1.846.8 1,393.1 1,615.5 CWIP 13.0 7.0 7.4 8.5 0.3 Long-Term Loans and 8.5 12.9 6.9 6.7 3.7 11.9 Other Debtors Non-Current Investments Other Non-Current Assets 102.0 9.3 Current Assets Other Current Assets 29.0 114.5 55.8 85.7 42.1 47.3 Accounts Receivable - 51.4 99.7 83.7 132.6 253.5 274.3 Trade Inventories 619.4 358.5 394.5 392.7 501.9 424.8 Short-Term Loans 12.2 20.8 26.0 28.8 Cash and Equivalents 274.7 1,891.8 1.292.0 1,341.8 606.7 126.4 Current Investments 3,126.1 1,832.4 1,568.4 1.836.6 2,750.6 3,385.4 Total Assets 4,940.7 5,551.5 5,792.9 5,679.2 5,662.2 5,895.3 Description/Year 12-Mar 13-Mar 14-Mar 15-Mar 16-Mar 17-Mar Revenue from Operations 4298.09 5509.51 6099.83 7497.33 7997.15 7968.97 Other Income 373.77 400.52 401.26 315.50 287.04 393.95 Total Income 4671.86 5910.03 6501.09 7812.84 8284.198362.92 Expenses: Cost of Material Consumed 1944.19 2183.73 2170.19 2549.54 2453.47 2078.26 Purchase of Stock in Trade 344.43 445.03 528.53 609.33 589.50 497.68 Changes in inventories of Finished goods, Work-in-progress and Traded Goo (89.59) (51.68) (11.18) 2.71 (63.26) 115.11 Employee Benefit Cost 228.96 295.02 341.81 390.50 475.41 613.89 Finance Cost 0.79 0.82 58.85 1.35 2.26 10.33 Depreciation 26.02 39.76 43.34 48.65 48.95 53.18 Other expenses 704.92 912.45 1210.71 1552.85 1804.79 2028.15 Total Expenses 3159.71 3825.12 4342.25 5154.94 5311.11 5396.60 Profit before exceptional items 1512.15 2084.91 2158.84 2657.90 2973.08 2966.33 Exceptional Income / Expenses 0.00 0.00 (285.97) (469.80) (469.80)|(183.84) Profit before tax 1512.15 2084.91 1872.88 2188.10 2503.28 2782.49 Current Income Tax 302.27 418.25 394.37 459.97 536.94 599.49 Deferred Tax 9.13 5.07 (10.76) 1.53 1.56 0.58 Profit or loss for the period 1200.75 1661.59 1489.26 1726.59 1964.78 2182.42 12-Har 13-Har 14-Har 15-Har 16-Har 17-Har Profitability Ratios Operating Profit Margin Net Profit Margin Return on invested Capital (ROIC/RO/ROCE) Return on Equity Return on Total Assets Capital Structure Ratios Debt-equity Ratio Liquidity Ratio Current Ratio DuPont Analysis ROE Net Profit Margin Total Asset Turnover Ratio Equity Multiplier Yorking Capital Management Inventory Turnover Ratio Debtors' Turnover Ratio Payable Turnover Ratio Days Sales Inventory Days Sales Receivables Days Paybles Outstanding Operating cycle