

Answered step by step
Verified Expert Solution
Question
1 Approved Answer
1. Calculate the projected profit margins for 2019, 2020 and 2021 based on the forecast earnings growth chart. 2. Show the calculation formulas in the
1. Calculate the projected profit margins for 2019, 2020 and 2021 based on the forecast earnings growth chart.
2. Show the calculation formulas in the cells of the spreadsheet.
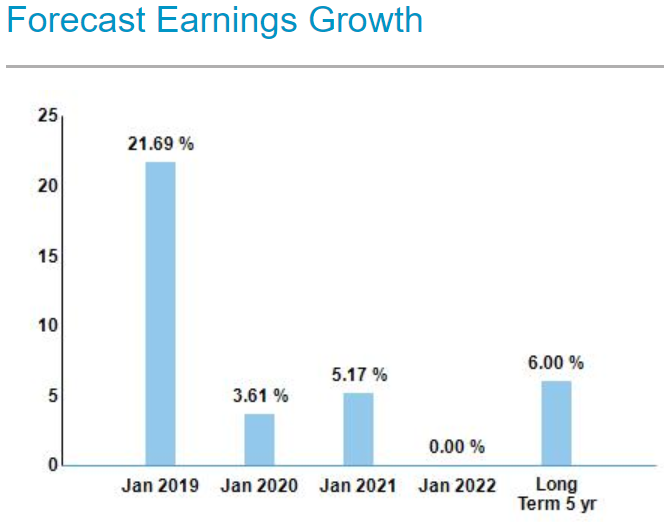
| Financial history and projected financial performance for Nordstrom, Inc beginning in 2017 through 2021 | |||||||||
| Fiscal year beginning February through January end-of-month the following year | |||||||||
| Period Ending: | 2017 (Feb 16-Jan 17) | 2018 (Feb 17-Jan 18) | 2019 (Feb 18-Jan 19) | 2020 (Feb 19-Jan 20) | 2021 (Feb 20-Jan 21) | ||||
| REVENUE (in millions) | $14,757 | $15,273 | |||||||
| EXPENSES (in millions) | ($9,440) | ($9,880) | |||||||
| CALCULATED PROFIT (in millions) | $5,317 | $5,393 | |||||||
| PROFIT MARGINS | 36.03% | 36.31% | |||||||
| PROJECTED REVENUE (in millions) | n/a | n/a | $15,808 | $16,361 | $16,934 | ||||
| PROJECTED EXPENSES (in millions) | n/a | n/a | ($10,005) | ($10,471) | ($10,787) | ||||
| PROJECTED PROFIT | n/a | n/a | $5,803 | $5,890 | $6,147 | ||||
| PROJECTED PROFIT MARGINS | n/a | n/a | |||||||
Step by Step Solution
There are 3 Steps involved in it
Step: 1

Get Instant Access to Expert-Tailored Solutions
See step-by-step solutions with expert insights and AI powered tools for academic success
Step: 2

Step: 3
Ace Your Homework with AI
Get the answers you need in no time with our AI-driven, step-by-step assistance
Get Started
How To Trade With High Probability
Authors: Ricardo Moneta
1st Edition
1542590159, 978-1542590150