

Question
1. Calculate the required rate of return on common equity (cost of common equity) for Pepsi using the following methods. a. Capital Asset Pricing Model
1.
Calculate the required rate of return on common equity (cost of common equity) for Pepsi using
the following methods.
a.
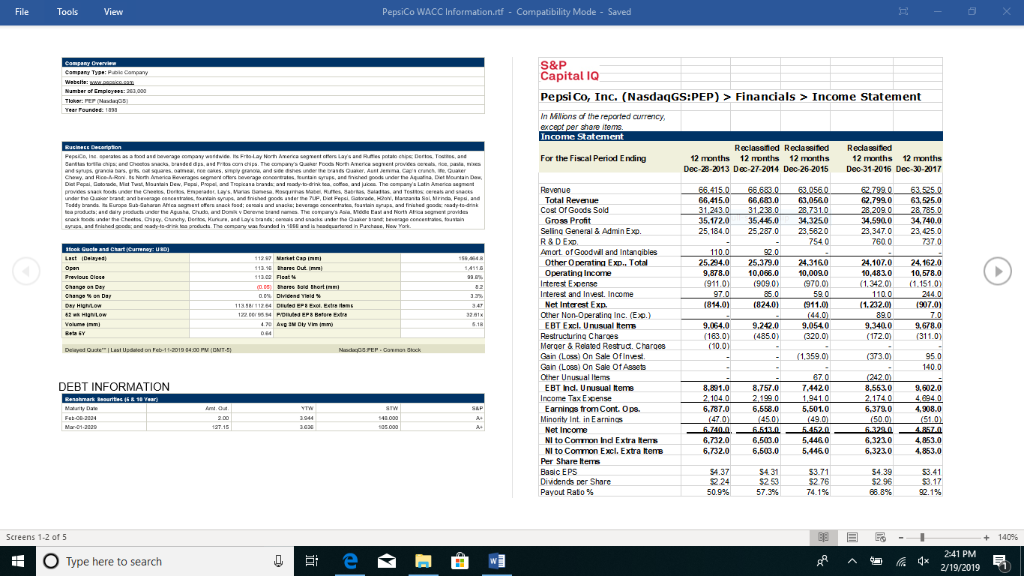
Capital Asset Pricing Model assuming a Market Risk Premium of 5.53% and a
Risk-Free Rate of 2.63%.
b.
Discounted Cash Flow Method when the growth rate is calculated as:
i.
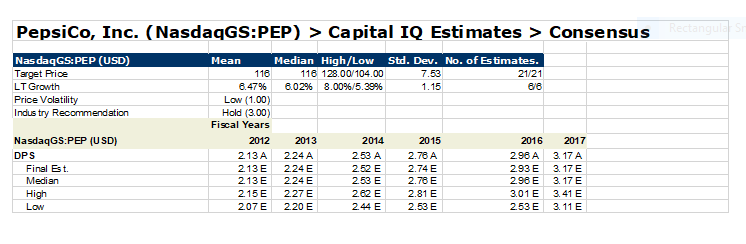
The average growth rate in dividends for the past five years.
ii.
The ROE multiplied by the Retention Rate
iii.
The analysts median estimate for long-term growth
2. Using the estimates that you calculated above, determine the estimated rate of return
on common equity.
Justify your estimate.
3. What is the estimated required rate of return for debt for Pepsi?
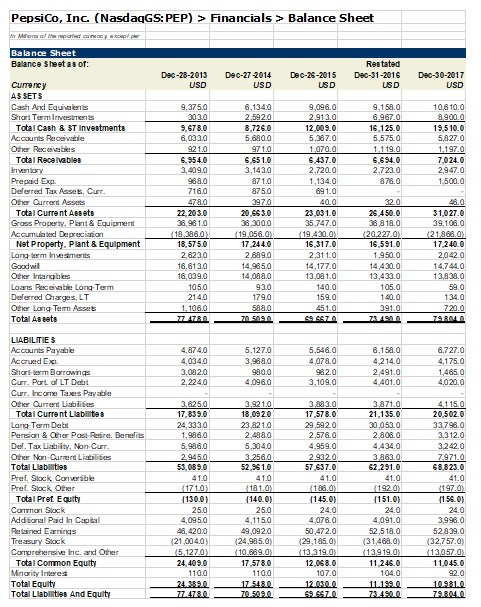
4. What are the weights of debt and equity for Pepsi?
5.Using the answers provided above and an estimated effective tax rate of 30%,
calculate the WACC for Pepsi. Use the required rate of return on common equity that you
provided in the answer to Question 2.
6. If Pepsi had no debt, what would Pepsis beta be? What would the required rate of
return on common equity be? (Again, assume an effective tax rate of 30%)
PepsiCo WACC Information.rtf - Compatibility Mode Saved PepsiCo, Inc. (NasdaqGS:PEP)Financials > Income Statement In MNions of the reported currency, except per shae items Reclassfied Reclasaifed Reclassifted 12 months For the Fiscal Period Ending 12 months Dec-28-2013 Dec-27-2014 Dec-26-2015 12 months 12 months 12 months Dec 31-2016 Dec-30-2017 6,415.066,683.063,0560 62,799063,525.0 Cost of Goods Sold Seling General & AdminExo. Amort of Goodwill and Intangibles 5.172.0 35,44.0 34,3250 5,27.023,5620 34.5900 34,740.0 23,347023,425.0 Other Operatina Exp., Total 5,24.0 25.379.024.3160 9,878.0 10,066.0 24.107.0 24,162.0 0,483010, 578.0 1342.0 (1.151.0) Interest and Invest. Income Net Interest Exp. Other Non-Operating Inc. (Exo.) 44.08907.0 9.064.0 9.242.0 EBT Excl. Unusual terrs 9.3400 9,678.0 13.0(485.0) Merger & Reiated Restua. Charges Gain (Loss) On Sale OfInves Gain (Loss) On Sale OfAsaets Other Unusual Items870(242.0 DEBT INFORMATION E BT id, unusual tem 8,891.0 8,757.0.4420 2104 0 2.1990 1.9410 2.1740 4 4 0 6,787.0 Income Tax Epense Earnings trom Cont. Ops. 6,558.0 Minority Int in Earnings NI to Conron Ind Extra Rens NI to Common Excl. Extra temB 732.0 6,50m.o ,732.06,503.05,446.0 O Type here to search * 2/19/2019 PepsiCo, Inc. (NasdaqGS: PEP)>Financials>Balance Sheet Balance Sheet Balance Sheet as of Dec-28-2013 Dac-27 2014 Dec-2-2015 Dec-31-2016 Dec-30-2017 USD USD AS SETS Cash And Equisents Shart Term Irvestments 9,096.0 0.1180 106 10.0 Total Cash &ST Investments 12,009.0 16.125.0 19,510.0 Total Recalvable 437.0 6,894.0 2,723.0 7,024.0 Prepsid Ep Deferred Tax Asses, Curr Oher Qurrert Asls 1,500.0 Total Current Assets 20,663.0 28,450.0 31,027.0 Grass Praperty, Pirit & Equipmert ccumu ted Depreciaia Net Property. Plant &Equipment 18,5750 16,317.0 16,591.0 2042.0 14,7440 4,430.0 13.433.0 Ofer rtargibes Loars Recevabe Long Term Defered Charges LT Otes Lang Tem Asset Total Assets Accourts Payable ccrued E Shart-term Barrawrigs Curr. Part of LT Debt Curr, home Taxs Payable Otfheer Currert iabliies i,120 5,546.0 6,1 175 980.0 2.491.0 3,109.0 20. Total Current Liabilntes 18,0920 17 578.0 21,135.0 30,053.0 2808.0 4.434.0 20,5020 33,798.0 029,592.0 2,576.0 24,3330 Persian & Oher Past Reire. Berits Del. Tax Liabiity, Non Cur Ofheer Nan-Currert Liatblites Total Llablilities Pref. Sock Convribl Pref. Stock Oher 52% 1.0 57 637.0 68823.0 Total Pret Equity 156.0 ari0 ari0 9,0920 24,985 50,472052,518.052839.0 21,0040) ,120 24,409.0 31468.0) 11 246.0 1.12 32,757.0 Total Common Equity narity Irterest 17,5780 12,068.0 1,045.0 92.0 10.0 Total Liabilities And Equity 20 PepsiCo, Inc. (NasdaqGS: PEP) > Capital IQ Estimates > Consensus NasdaqGS: PEP (USD) Target Price LT Growth Price Volatility Indus try Recommendation Mean Median High/Low Std. Dev. No. of Estimates 118 8.47% 116 128.00/104.00 .02% 8.00%/5.35% 7.53 1.15 21/21 Low (1.00) Hold (3.00) Fiscal Years NasdaqGS:PEP (USD) DP S 2012 213A 224A 213E 224 E 213E 224E 215E 227E 207E 220 E 2013 2014 2015 Final Est Median Hi Low 253 A2.78A 252 E 2.74 E 2.76 E 2.81 E 2.53 E 2016 2017 298A 3.17 A 293E 3.17 E 298E 3.17 E 301 E 3.41E 253E 3.11 E 253 E 262 E 244 E PepsiCo WACC Information.rtf - Compatibility Mode Saved PepsiCo, Inc. (NasdaqGS:PEP)Financials > Income Statement In MNions of the reported currency, except per shae items Reclassfied Reclasaifed Reclassifted 12 months For the Fiscal Period Ending 12 months Dec-28-2013 Dec-27-2014 Dec-26-2015 12 months 12 months 12 months Dec 31-2016 Dec-30-2017 6,415.066,683.063,0560 62,799063,525.0 Cost of Goods Sold Seling General & AdminExo. Amort of Goodwill and Intangibles 5.172.0 35,44.0 34,3250 5,27.023,5620 34.5900 34,740.0 23,347023,425.0 Other Operatina Exp., Total 5,24.0 25.379.024.3160 9,878.0 10,066.0 24.107.0 24,162.0 0,483010, 578.0 1342.0 (1.151.0) Interest and Invest. Income Net Interest Exp. Other Non-Operating Inc. (Exo.) 44.08907.0 9.064.0 9.242.0 EBT Excl. Unusual terrs 9.3400 9,678.0 13.0(485.0) Merger & Reiated Restua. Charges Gain (Loss) On Sale OfInves Gain (Loss) On Sale OfAsaets Other Unusual Items870(242.0 DEBT INFORMATION E BT id, unusual tem 8,891.0 8,757.0.4420 2104 0 2.1990 1.9410 2.1740 4 4 0 6,787.0 Income Tax Epense Earnings trom Cont. Ops. 6,558.0 Minority Int in Earnings NI to Conron Ind Extra Rens NI to Common Excl. Extra temB 732.0 6,50m.o ,732.06,503.05,446.0 O Type here to search * 2/19/2019 PepsiCo, Inc. (NasdaqGS: PEP)>Financials>Balance Sheet Balance Sheet Balance Sheet as of Dec-28-2013 Dac-27 2014 Dec-2-2015 Dec-31-2016 Dec-30-2017 USD USD AS SETS Cash And Equisents Shart Term Irvestments 9,096.0 0.1180 106 10.0 Total Cash &ST Investments 12,009.0 16.125.0 19,510.0 Total Recalvable 437.0 6,894.0 2,723.0 7,024.0 Prepsid Ep Deferred Tax Asses, Curr Oher Qurrert Asls 1,500.0 Total Current Assets 20,663.0 28,450.0 31,027.0 Grass Praperty, Pirit & Equipmert ccumu ted Depreciaia Net Property. Plant &Equipment 18,5750 16,317.0 16,591.0 2042.0 14,7440 4,430.0 13.433.0 Ofer rtargibes Loars Recevabe Long Term Defered Charges LT Otes Lang Tem Asset Total Assets Accourts Payable ccrued E Shart-term Barrawrigs Curr. Part of LT Debt Curr, home Taxs Payable Otfheer Currert iabliies i,120 5,546.0 6,1 175 980.0 2.491.0 3,109.0 20. Total Current Liabilntes 18,0920 17 578.0 21,135.0 30,053.0 2808.0 4.434.0 20,5020 33,798.0 029,592.0 2,576.0 24,3330 Persian & Oher Past Reire. Berits Del. Tax Liabiity, Non Cur Ofheer Nan-Currert Liatblites Total Llablilities Pref. Sock Convribl Pref. Stock Oher 52% 1.0 57 637.0 68823.0 Total Pret Equity 156.0 ari0 ari0 9,0920 24,985 50,472052,518.052839.0 21,0040) ,120 24,409.0 31468.0) 11 246.0 1.12 32,757.0 Total Common Equity narity Irterest 17,5780 12,068.0 1,045.0 92.0 10.0 Total Liabilities And Equity 20 PepsiCo, Inc. (NasdaqGS: PEP) > Capital IQ Estimates > Consensus NasdaqGS: PEP (USD) Target Price LT Growth Price Volatility Indus try Recommendation Mean Median High/Low Std. Dev. No. of Estimates 118 8.47% 116 128.00/104.00 .02% 8.00%/5.35% 7.53 1.15 21/21 Low (1.00) Hold (3.00) Fiscal Years NasdaqGS:PEP (USD) DP S 2012 213A 224A 213E 224 E 213E 224E 215E 227E 207E 220 E 2013 2014 2015 Final Est Median Hi Low 253 A2.78A 252 E 2.74 E 2.76 E 2.81 E 2.53 E 2016 2017 298A 3.17 A 293E 3.17 E 298E 3.17 E 301 E 3.41E 253E 3.11 E 253 E 262 E 244 EStep by Step Solution
There are 3 Steps involved in it
Step: 1

Get Instant Access to Expert-Tailored Solutions
See step-by-step solutions with expert insights and AI powered tools for academic success
Step: 2

Step: 3
Ace Your Homework with AI
Get the answers you need in no time with our AI-driven, step-by-step assistance
Get Started
Issues In Finance And Monetary Policy
Authors: J. McCombie ,C. Rodríguez González
1st Edition
0230007988,0230801498