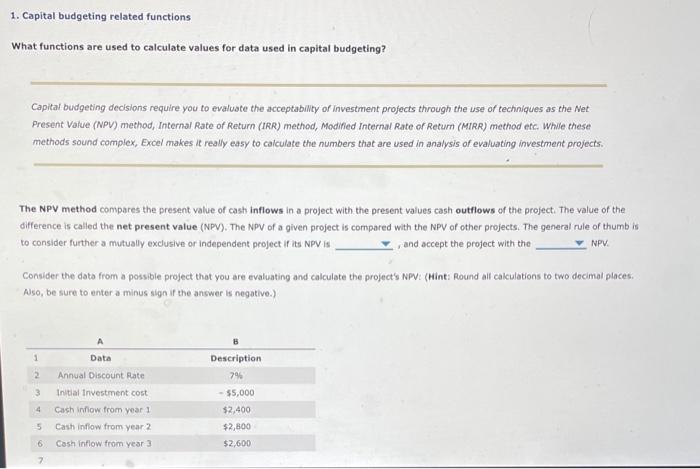
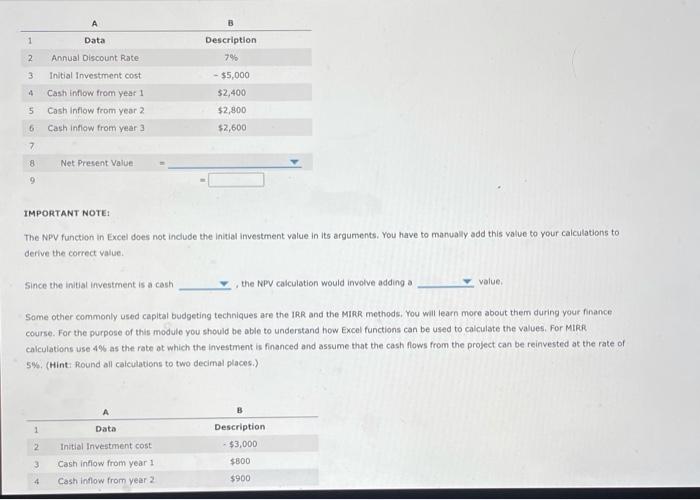
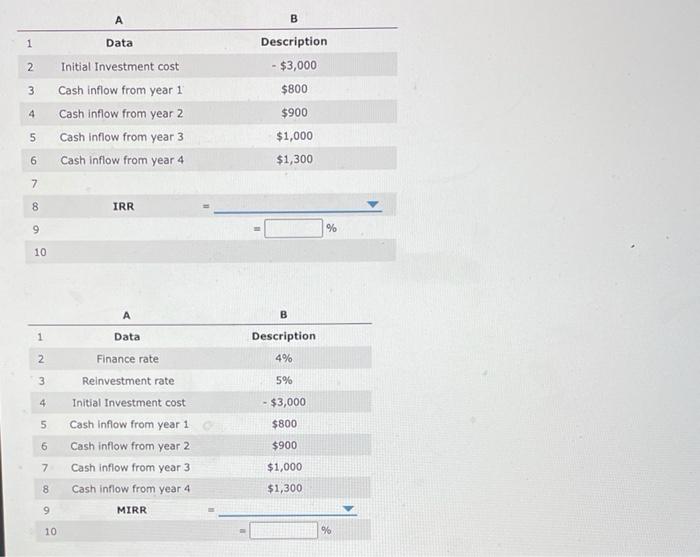
1. Capital budgeting related functions What functions are used to calculate values for data used in capital budgeting? Capital budgeting decisions require you to evaluate the acceptability of investment profects through the use of techniques as the Met Present Value (NPV) method, Internal Rate of Return (IRR) method, Modified Internal Rate of Return (MIRR) method etc. While these methods sound complex, Excel makes it really easy to calculate the numbers that are used in analysis of evaluating investment projects. The NPV method compares the present value of cash inflows in a project with the present values cash outflows of the project. The value of the difference is called the net present value (NPV). The NPV of a given project is compared with the NPV of other projects. The general rule of thumb is to consider further a mutually excusive or independent peoject if its NPV is , and accept the project with the NPPV. Consider the data from a possible project that you are evaluating and calculate the project's NPV: (Hint: Round all calculations to two decimal places. Aso, be sure to enter a minus sign if the ancwer is negative.) TMPORTANT NOTE: The Npy function in Excel does not include the initial investment value in its arguments. You have to manually add this value to your calculations to derive the correct value. Since the initial investment is a cash , the NPV calculation would involve adding a value, Same other commonly used capital budgeting techniques are the 1RR and the MiRR methods. You will learn more about them during your finance course. For the purpose of this module you shouid be able to understand how Excel functions can be used to calculate the values, For Mirk calculations use 405 as the rate ot which the investment is financed and assume that the cash flows from the project can be reinvested at the rate of 5\%. (Hint: foond all calculations to two decimal places.) \begin{tabular}{ccc} & Data & Description \\ \hline 1 & Initial Investment cost & $3,000 \\ 2 & Cash inflow from year 1 & $800 \\ 3 & Cash inflow from year 2 & $900 \\ 4 & Cash inflow from year 3 & $1,000 \\ \hline 6 & Cash inflow from year 4 & $1,300 \\ 7 & & IRR \\ \hline 8 & & \end{tabular} \begin{tabular}{ccc} & A & B \\ \hline 1 & Data & Description \\ 2 & Finance rate & 4% \\ 3 & Reinvestment rate & 5% \\ 4 & Initial Investment cost & $3,000 \\ 5 & Cash inflow from year 1 & $800 \\ 6 & Cash inflow from year 2 & $900 \\ 7 & Cash inflow from year 3 & $1,000 \\ 8 & Cash inflow from year 4 & $1,300 \\ 9 & MIRR \\ 10 & \end{tabular}


