1) Cincinnati Paint Company sells quality brands of paints through hardware stores throughout the United States. The company mainta a large sales force who call
1)
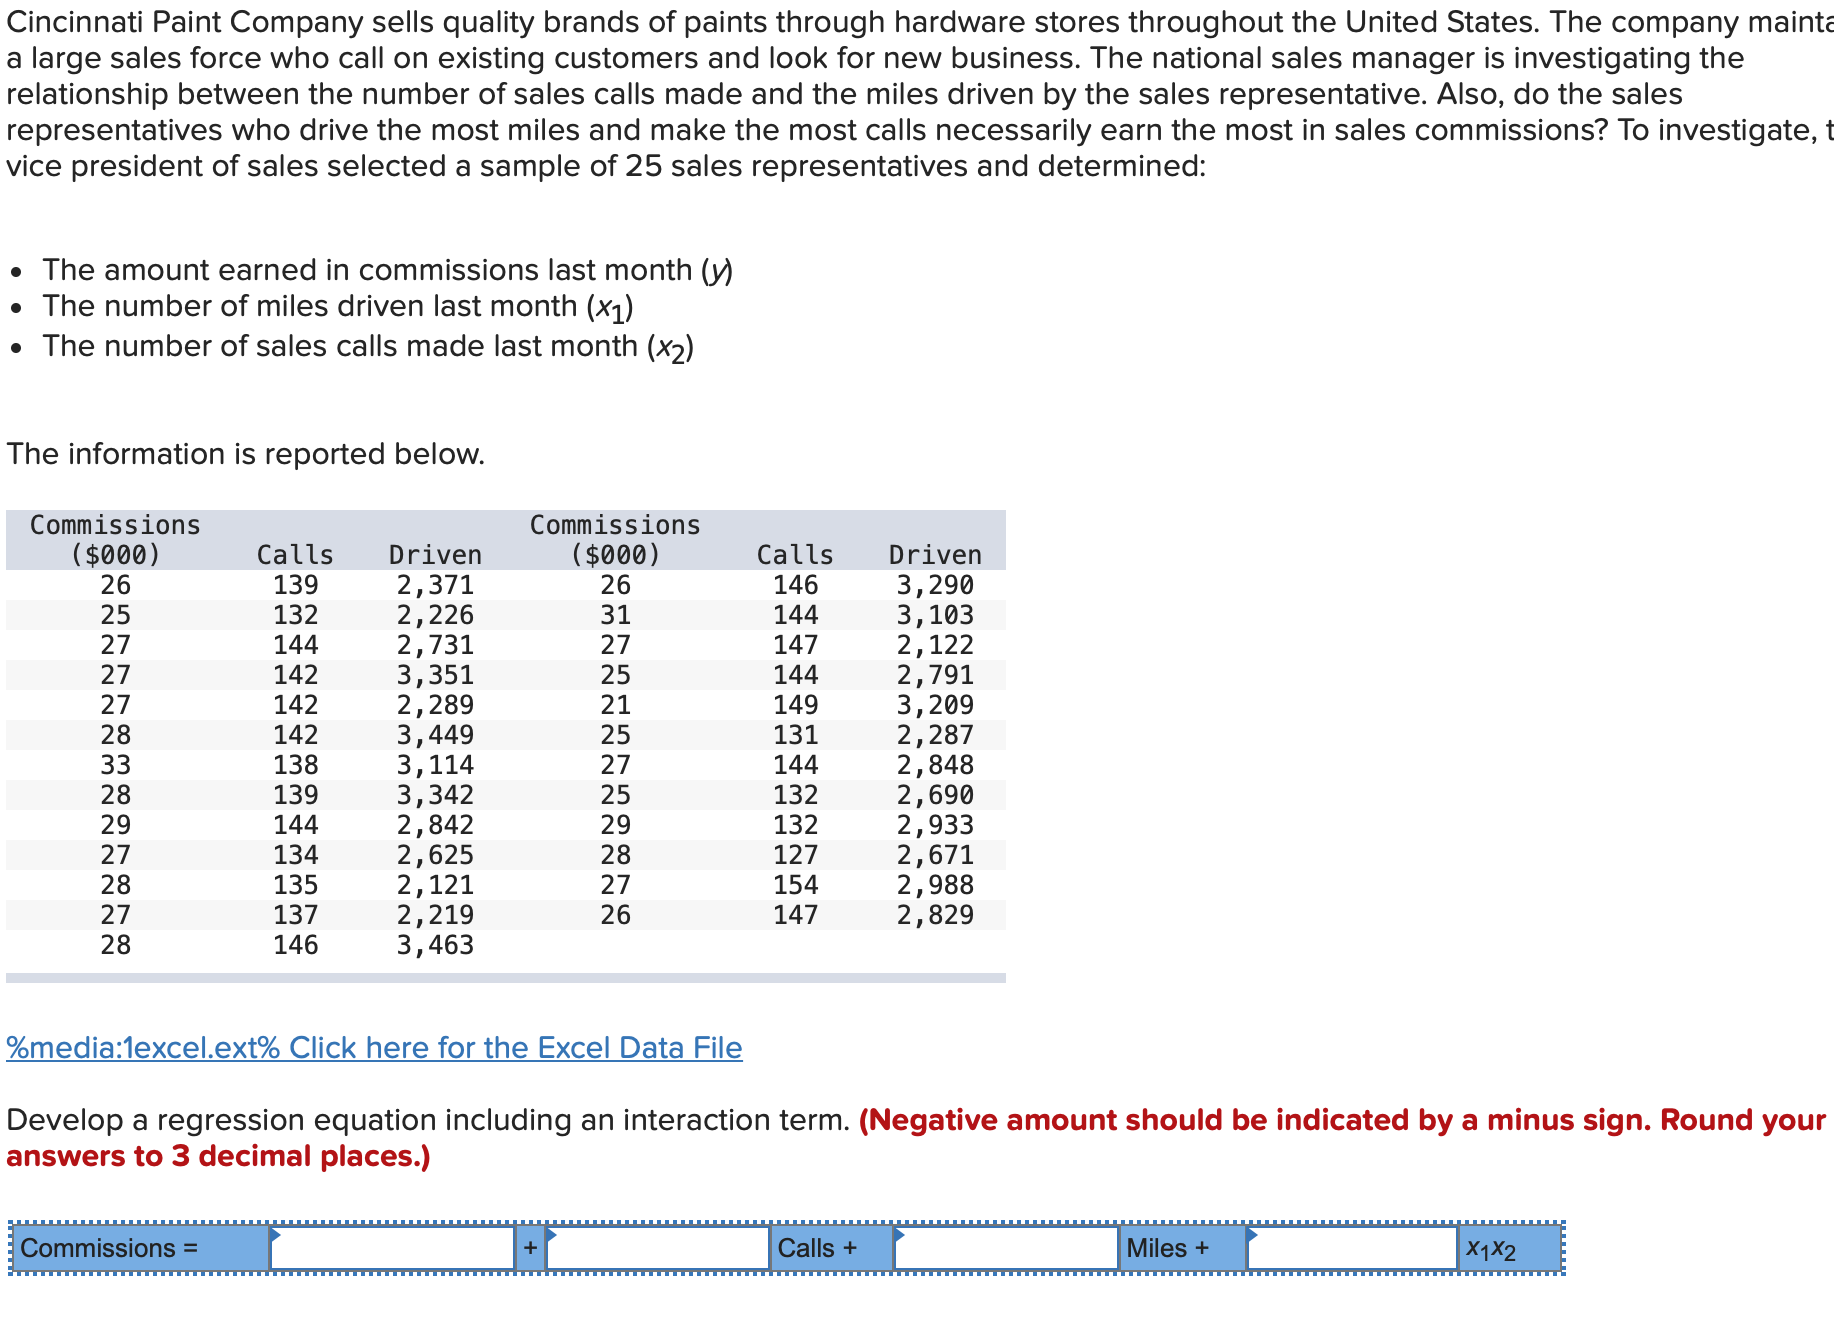
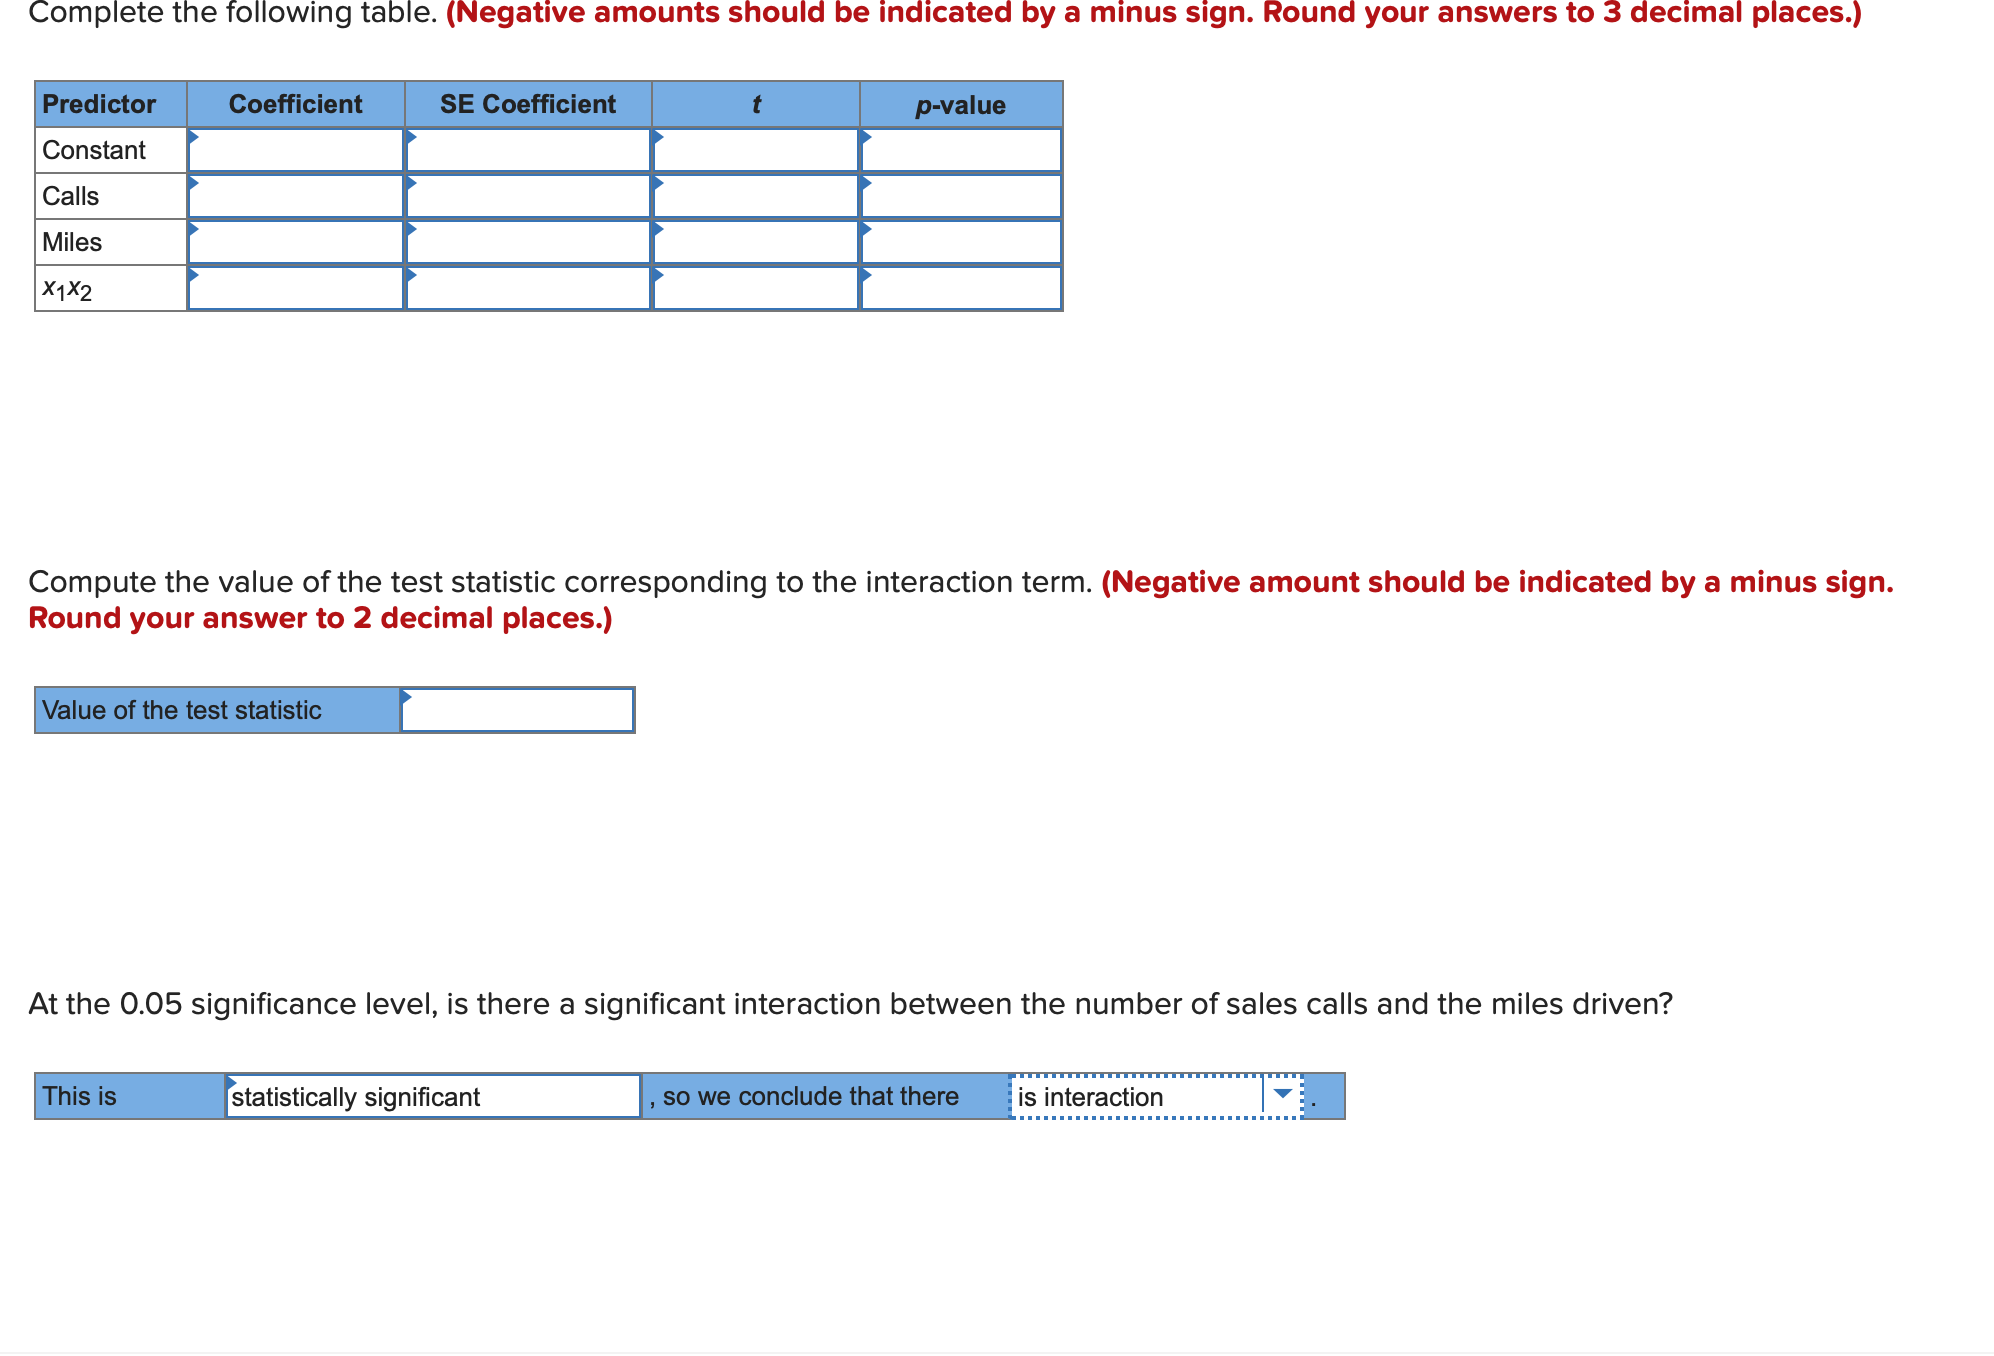
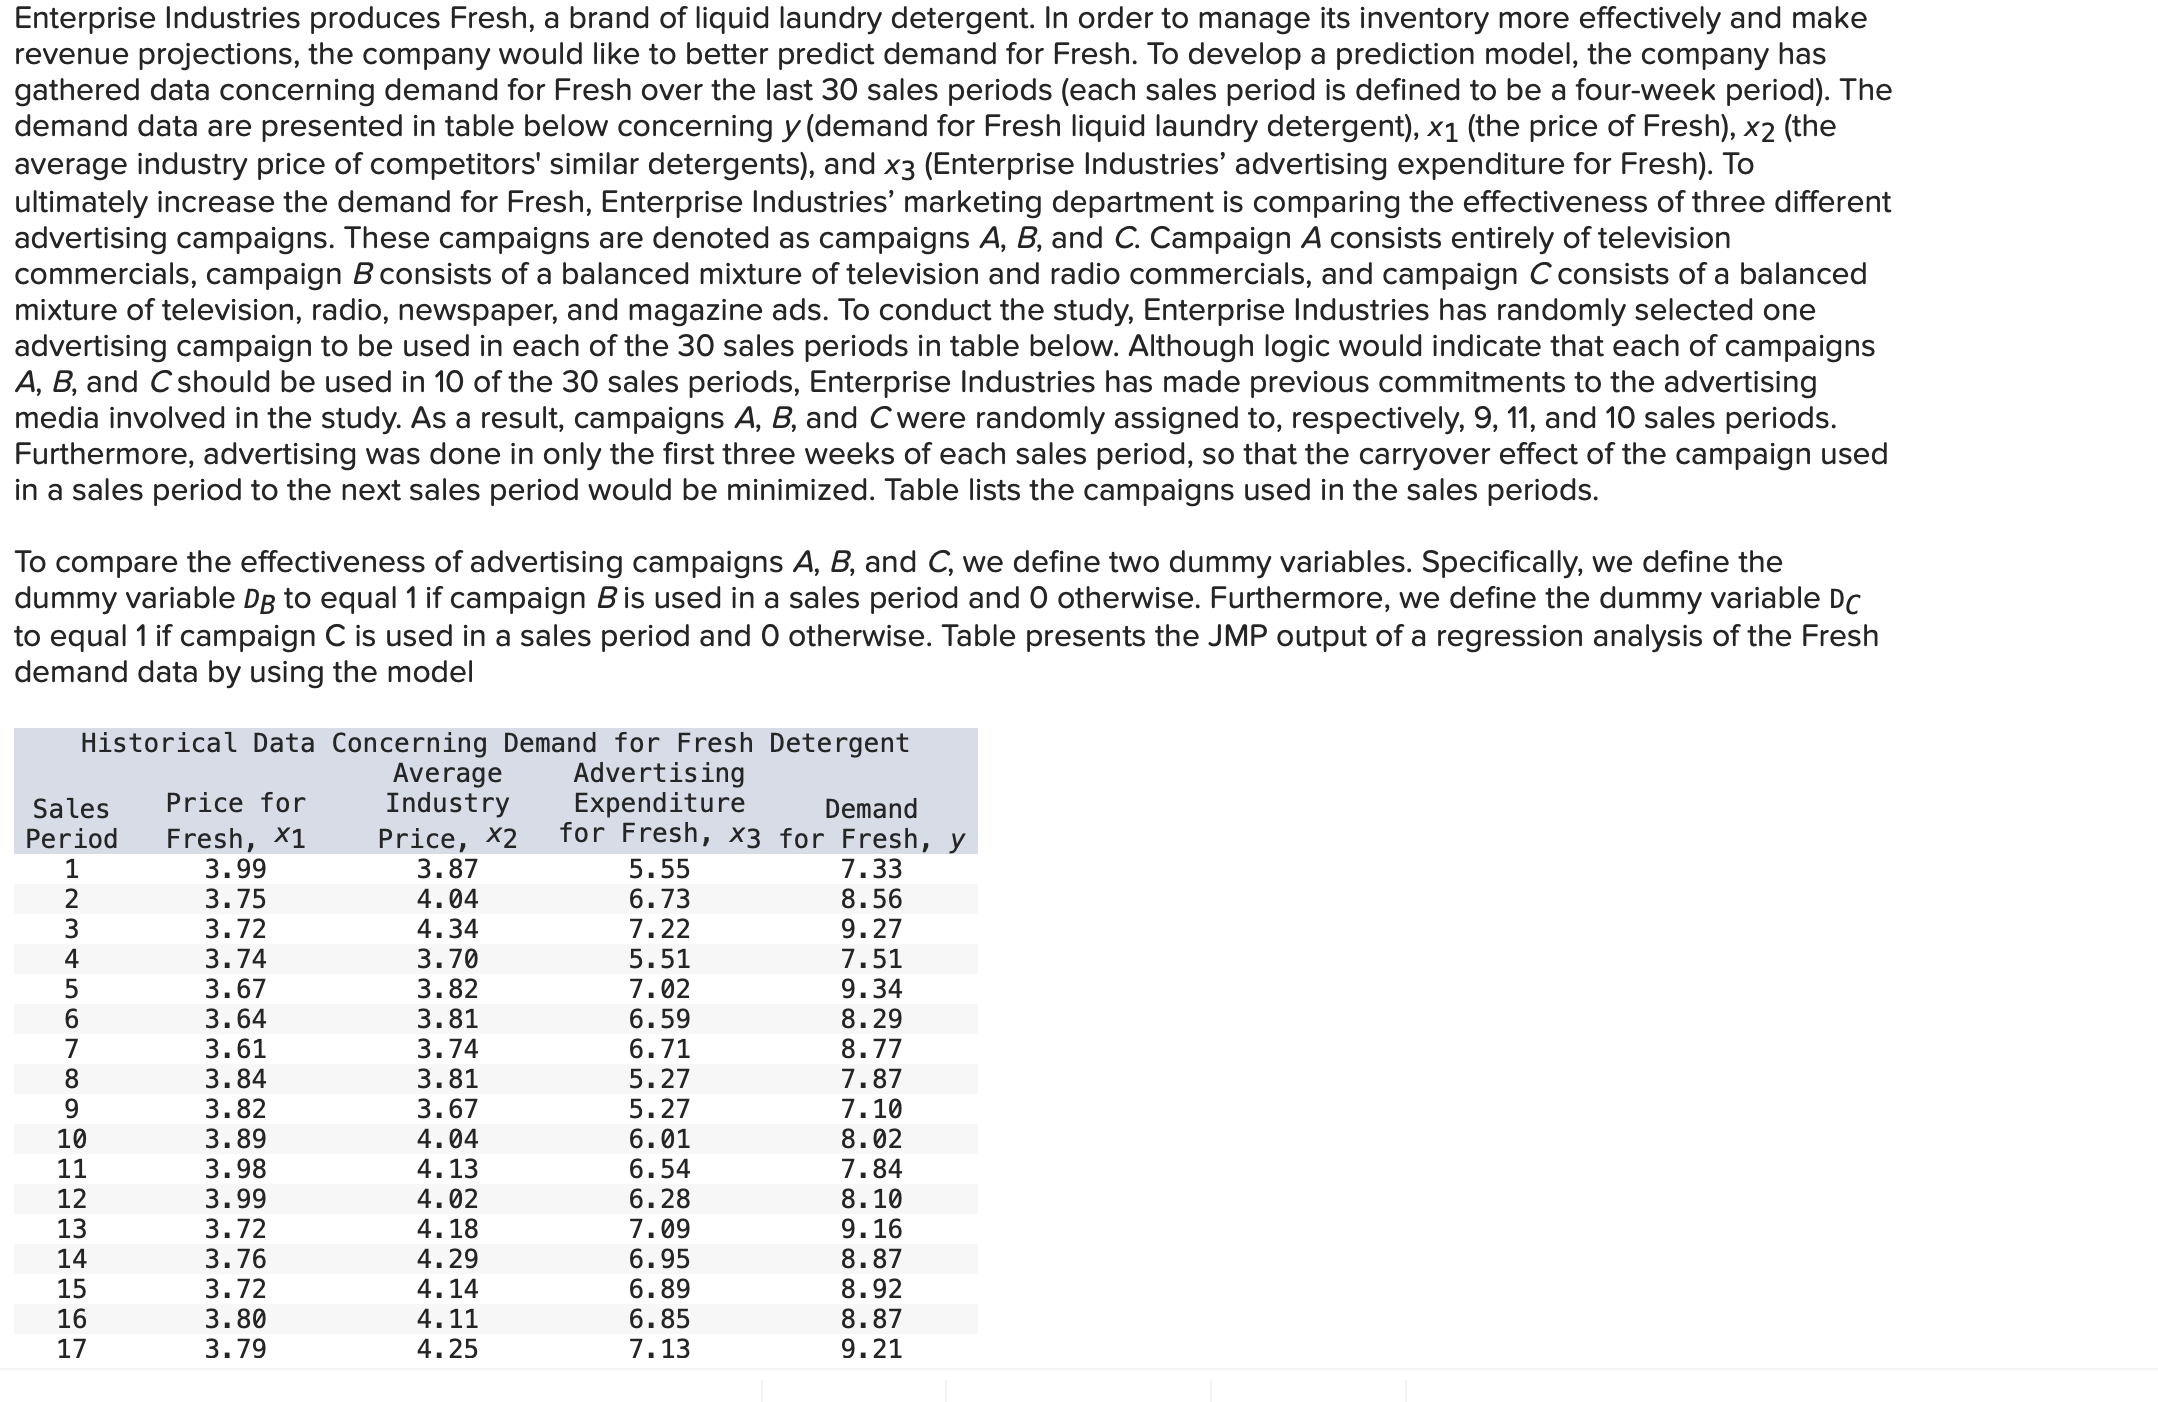
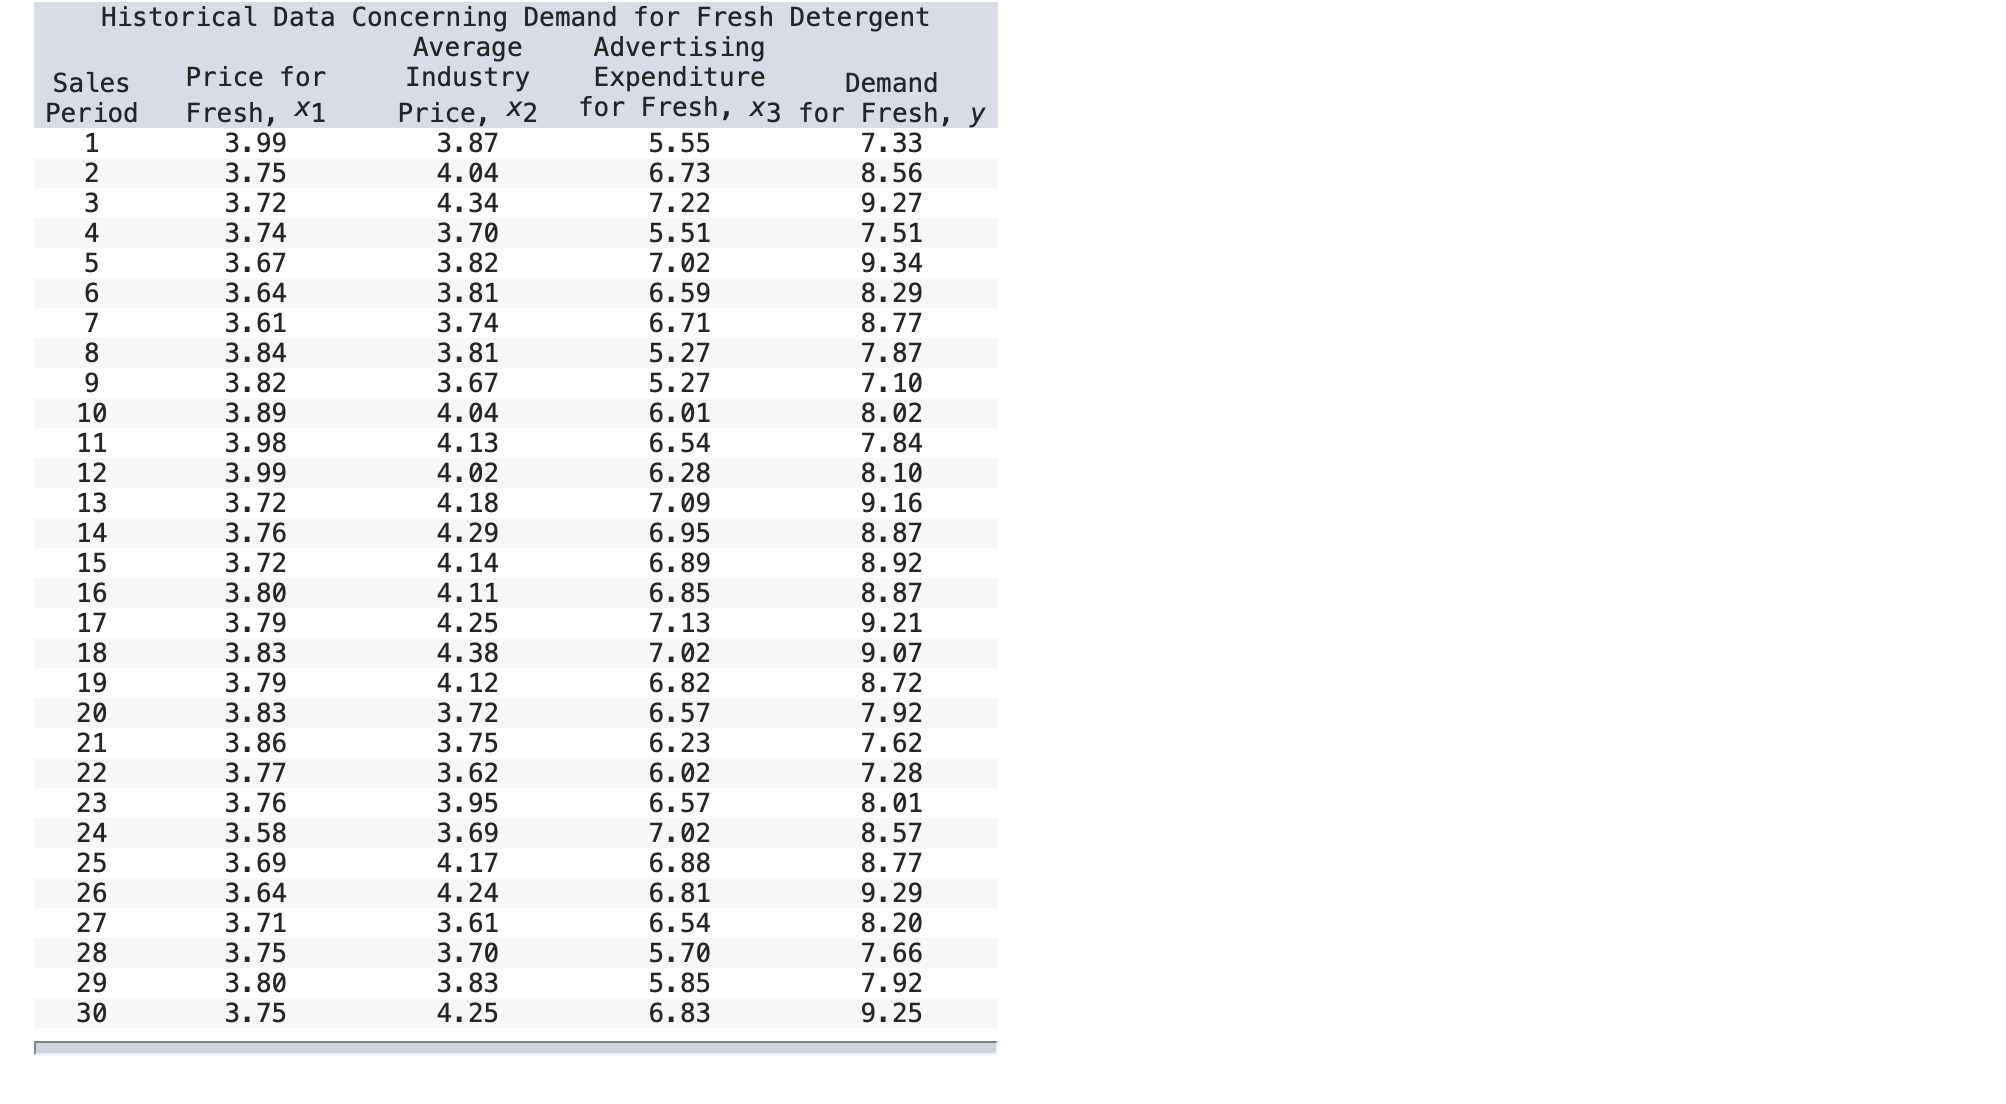
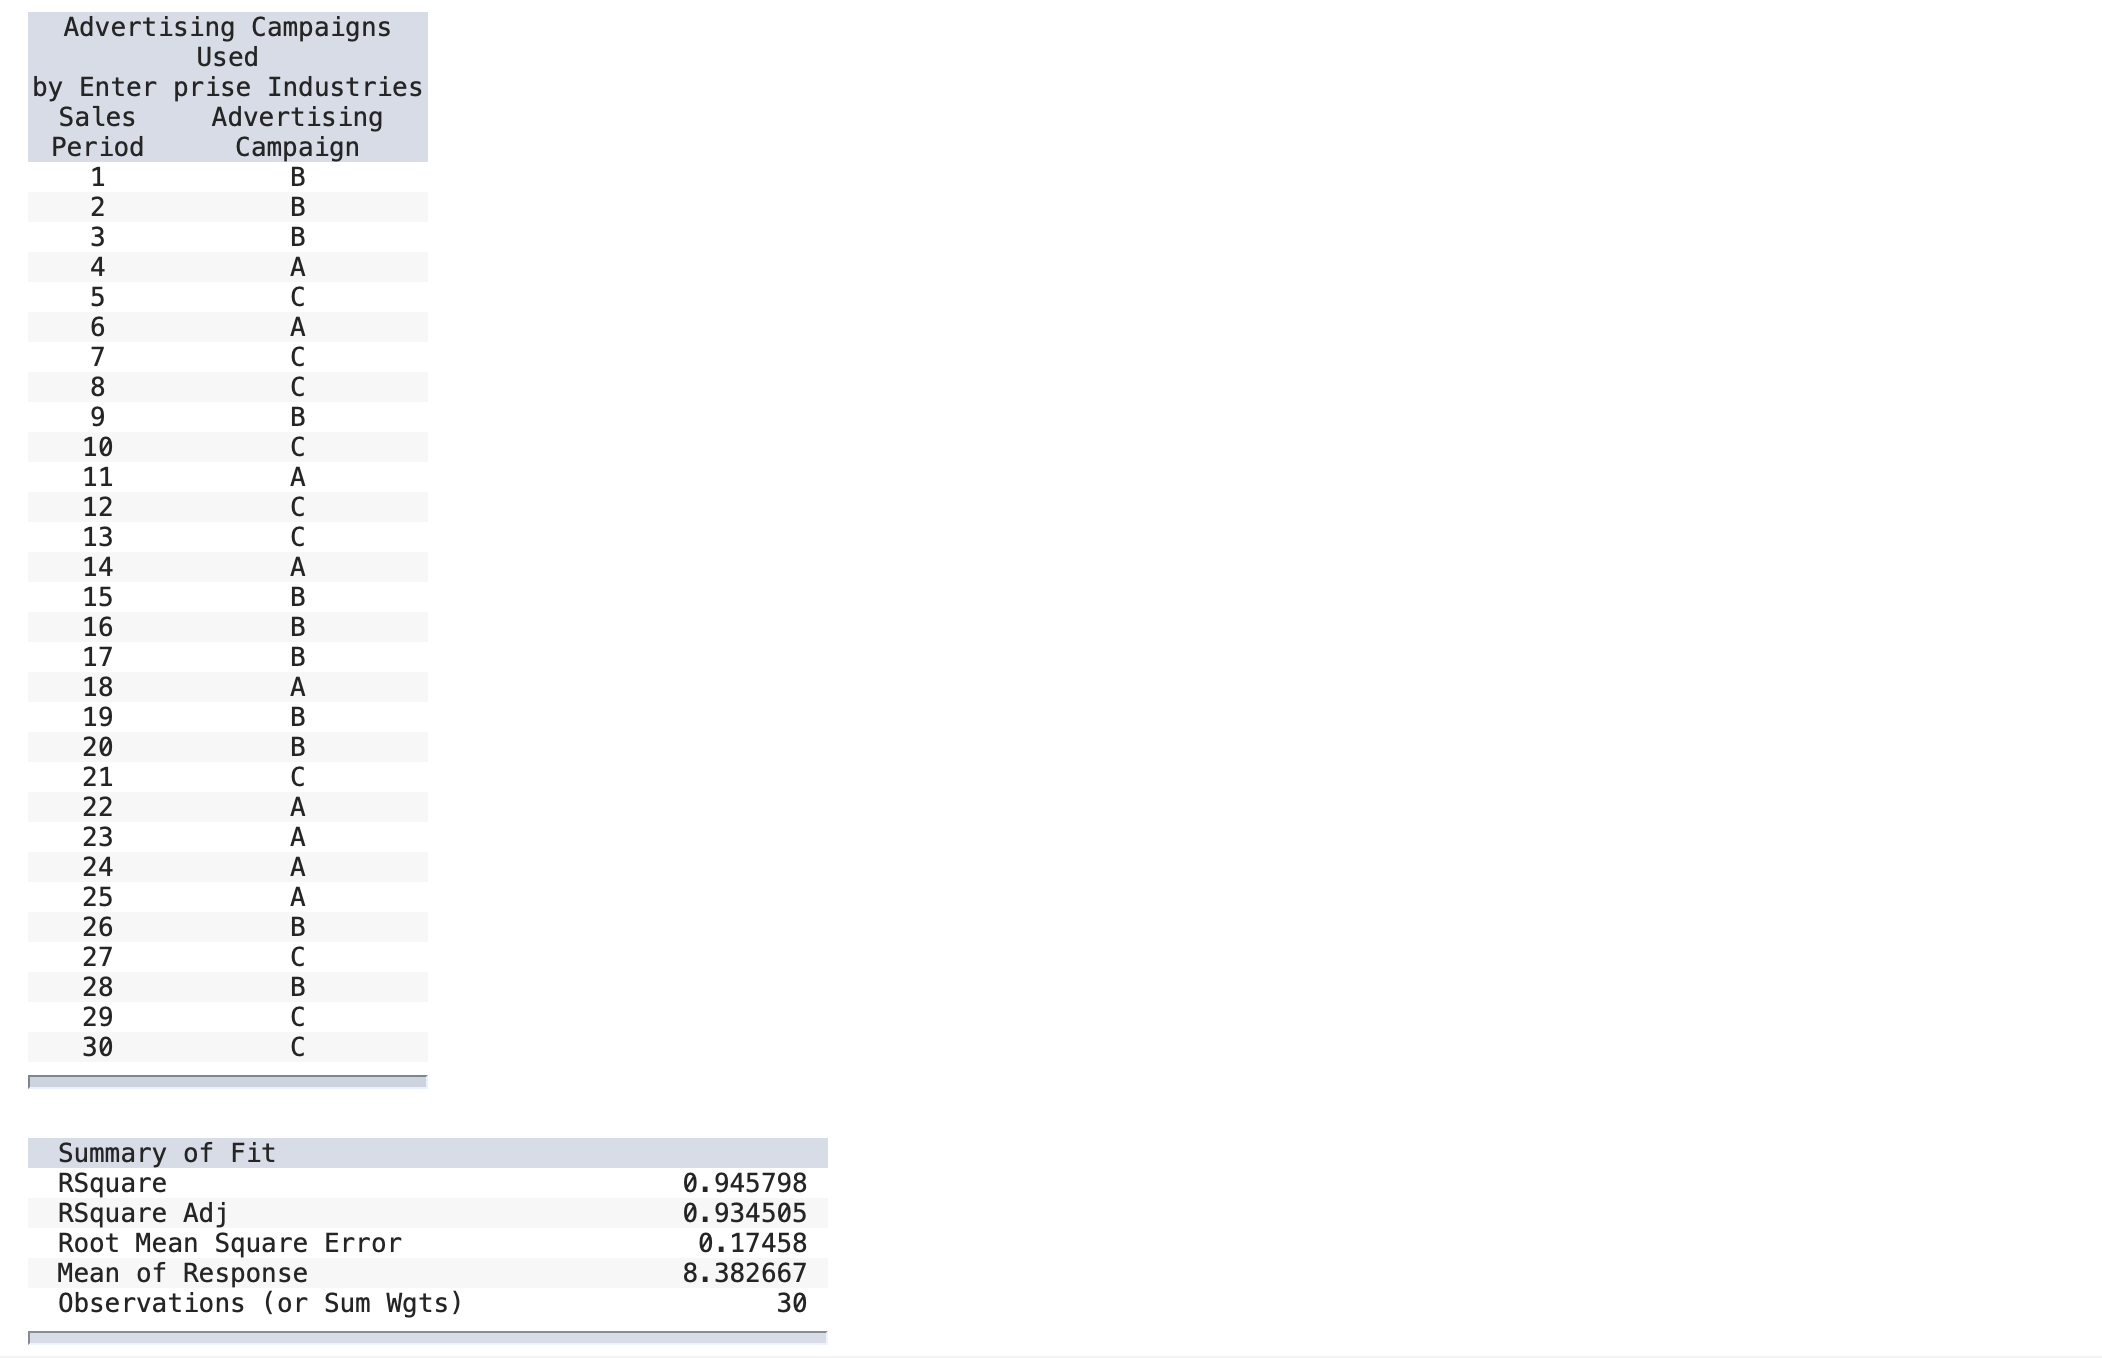
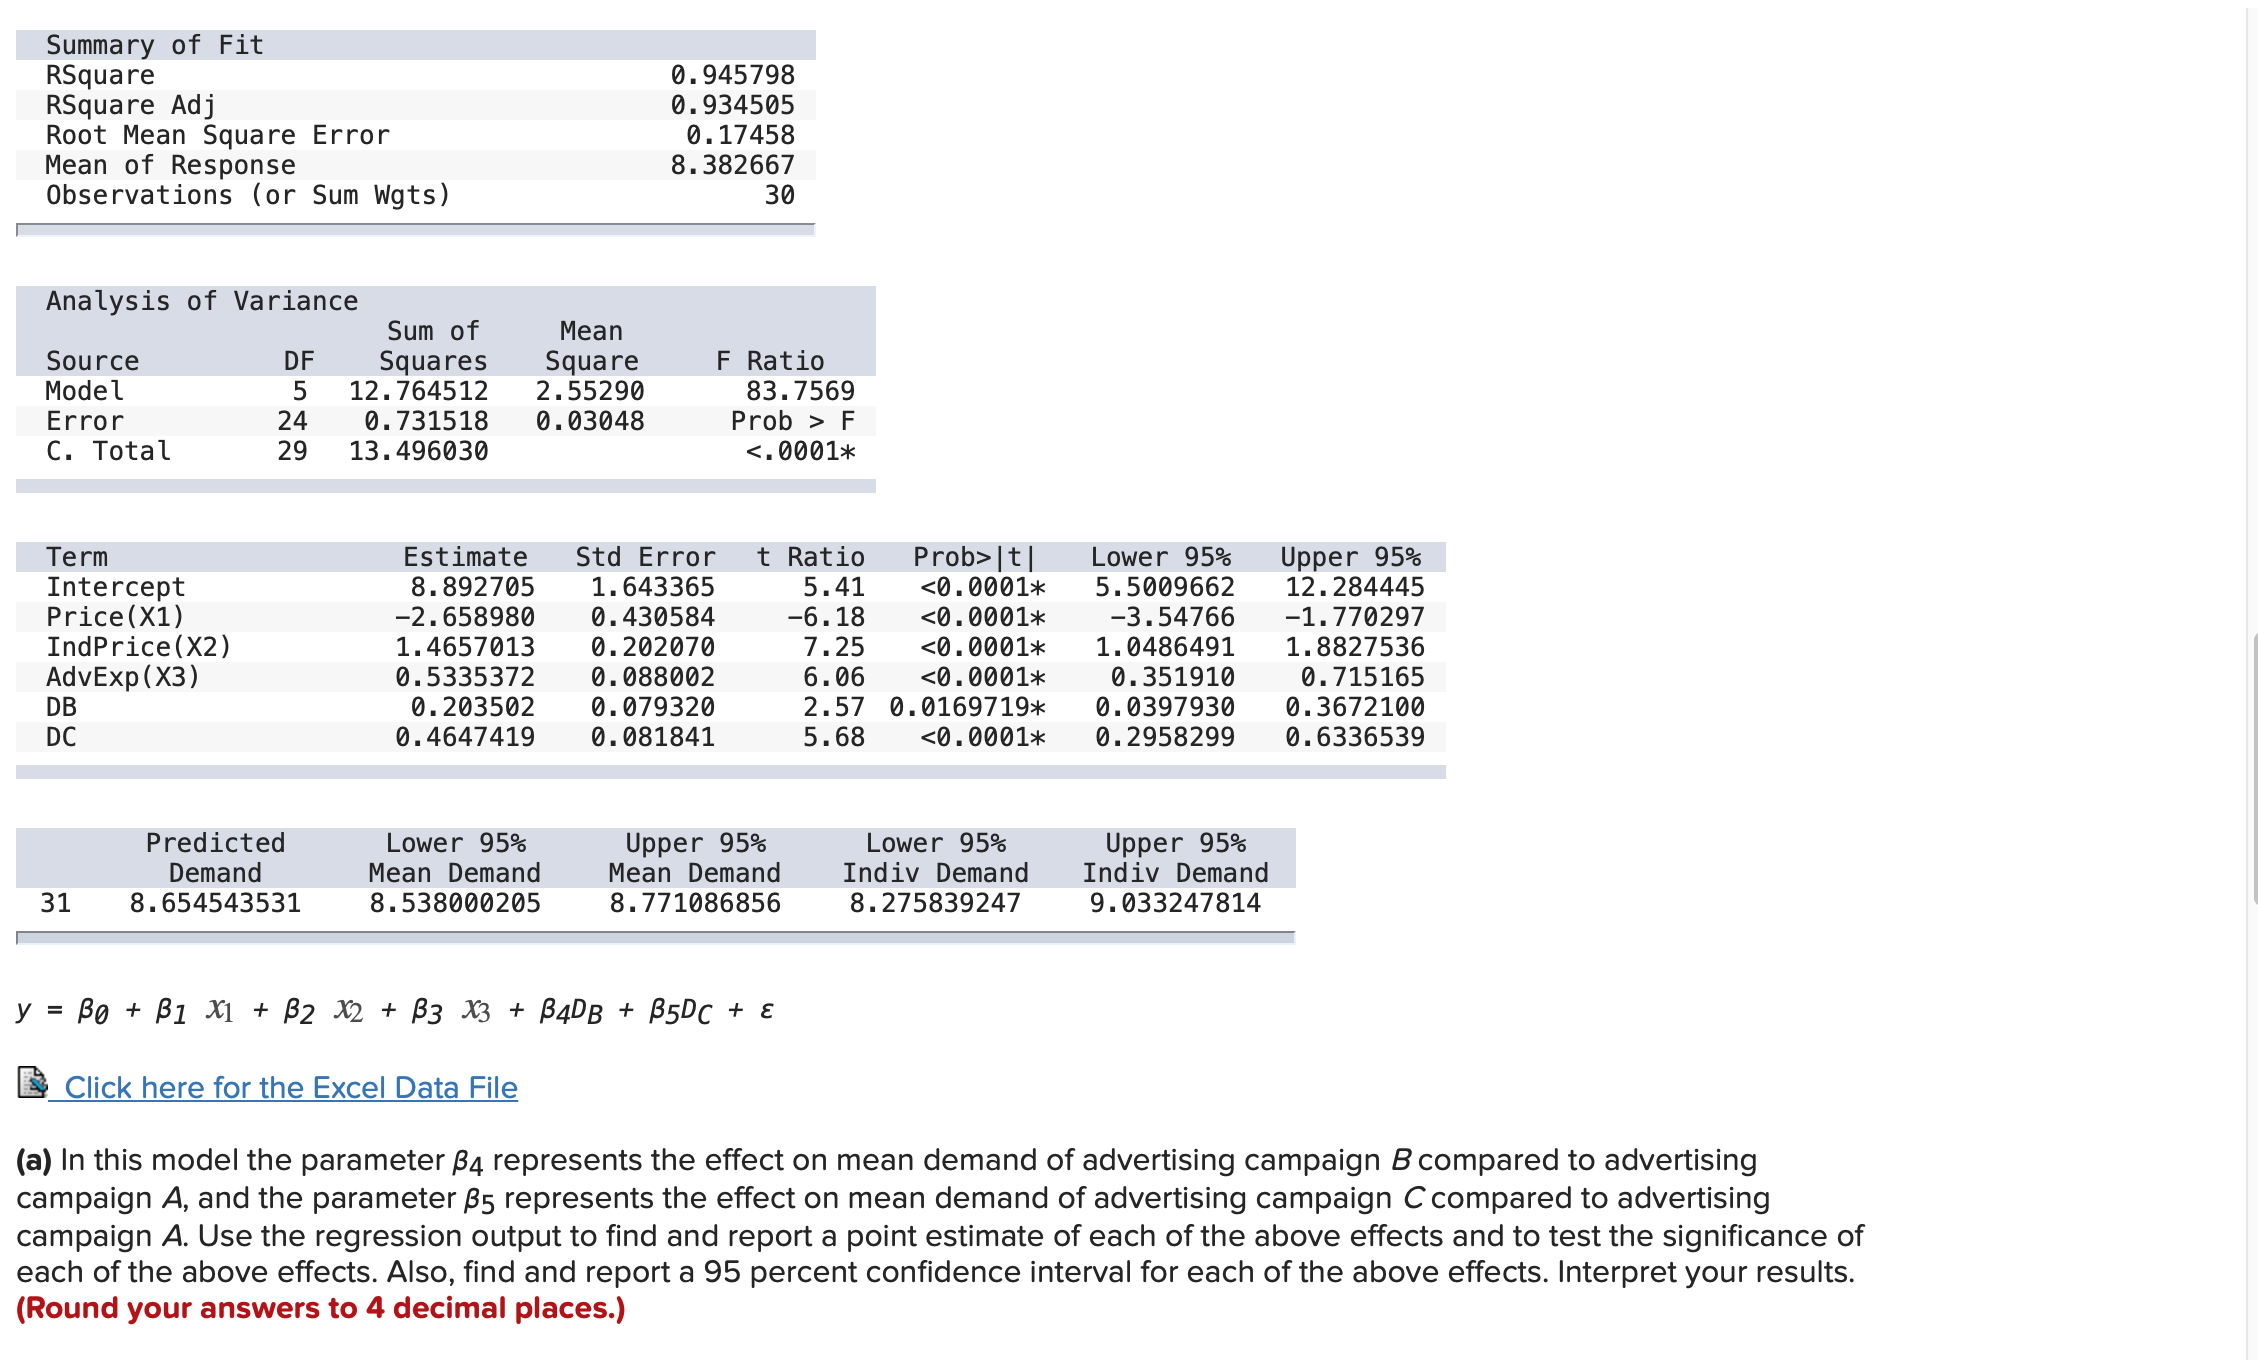
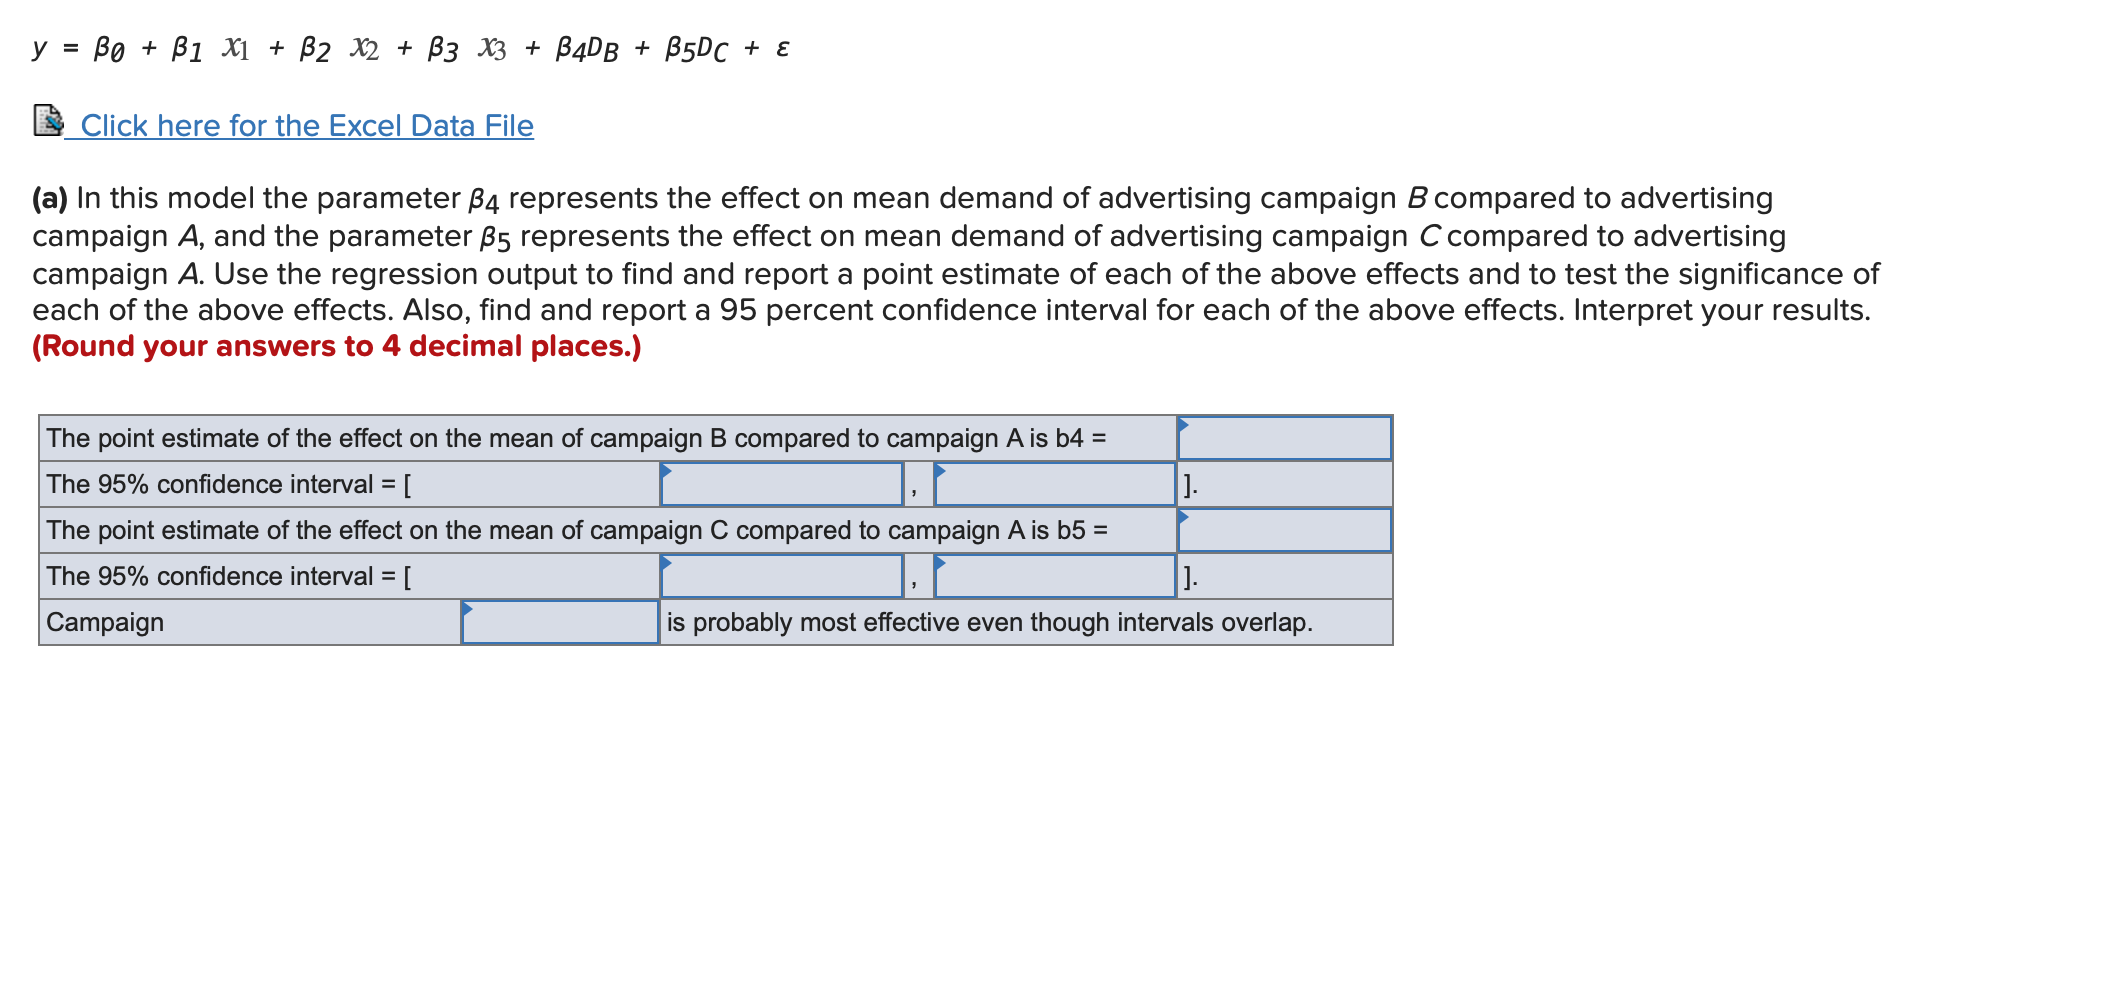
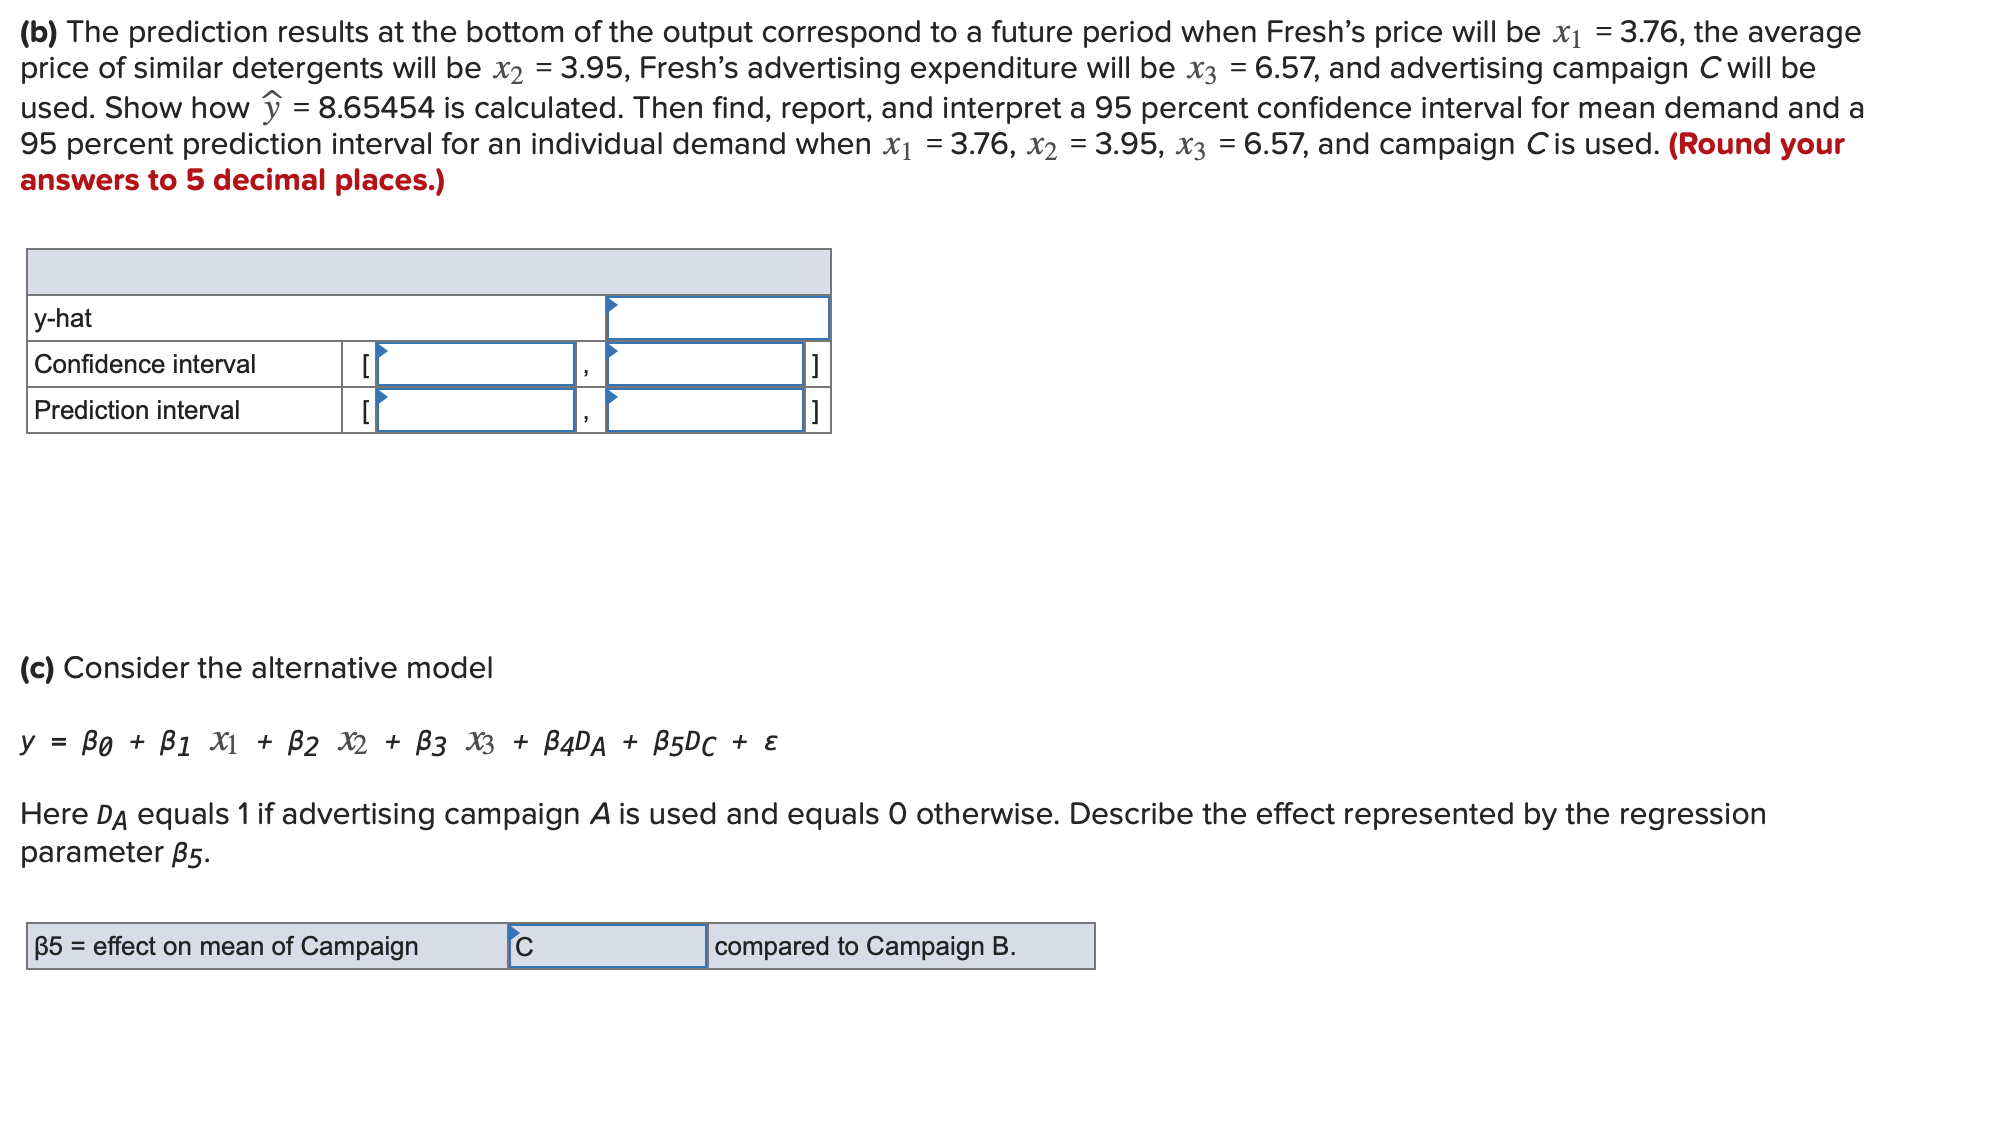
Cincinnati Paint Company sells quality brands of paints through hardware stores throughout the United States. The company mainta a large sales force who call on existing customers and look for new business. The national sales manager is investigating the relationship between the number of sales calls made and the miles driven by the sales representative. Also, do the sales representatives who drive the most miles and make the most calls necessarily earn the most in sales commissions? To investigate, t vice president of sales selected a sample of 25 sales representatives and determined: . The amount earned in commissions last month (y) - The number of miles driven last month (x1) . The number of sales calls made last month (X2) The information is reported below. Commissions Commissions ($000) Calls Driven ($000) Calls Driven 26 139 2,371 26 146 3,290 25 132 2,226 31 144 3,103 27 144 2,731 27 147 2,122 27 142 3,351 25 144 2,791 27 142 2,289 21 149 3,209 28 142 3,449 25 131 2,287 33 138 3,114 27 144 2,848 28 139 3,342 25 132 2,690 29 144 2,842 29 132 2,933 27 134 2,625 28 127 2,671 28 135 2,121 27 154 2,988 27 137 2,219 26 147 2,829 28 146 3,463 %media:1excel.ext% Click here for the Excel Data File Develop a regression equation including an interaction term. (Negative amount should be indicated by a minus sign. Round your answers to 3 decimal places.) W Complete the following table. (Negative amounts should be indicated by a minus sign. Round your answers to 3 decimal places.) Predictor Coefficient SE Coefficient t p-value Constant Calls Miles X1X2 Compute the value of the test statistic corresponding to the interaction term. (Negative amount should be indicated by a minus sign. Round your answer to 2 decimal places.) Value of the test statistic At the 0.05 significance level, is there a significant interaction between the number of sales calls and the miles driven? This is statistically significant , so we conclude that there is interactionEnterprise Industries produces Fresh, a brand ofliquid laundry detergent. In order to manage its inventory more effectively and make revenue projections, the company would like to better predict demand for Fresh. To develop a prediction model, the company has gathered data concerning demand for Fresh over the last 30 sales periods (each sales period is defined to be a four-week period). The demand data are presented in table below concerning y(demand for Fresh liquid laundry detergent), x1 (the price of Fresh), x2 (the average industry price of competitors' similar detergents), and x3 (Enterprise Industries' advertising expenditure for Fresh). To ultimately increase the demand for Fresh, Enterprise Industries' marketing department is comparing the effectiveness of three different advertising campaigns. These campaigns are denoted as campaigns A, B, and C. Campaign A consists entirely oftelevision commercials, campaign Bconsists of a balanced mixture oftelevision and radio commercials, and campaign Cconsists of a balanced mixture of television, radio, newspaper, and magazine ads. To conduct the study, Enterprise Industries has randomly selected one advertising campaign to be used in each of the 30 sales periods in table below. Although logic would indicate that each of campaigns A, B, and Cshould be used in 10 of the 30 sales periods, Enterprise Industries has made previous commitments to the advertising media involved in the study. As a result, campaigns A, B, and Cwere randomly assigned to, respectively, 9, 11, and 10 sales periods. Furthermore, advertising was done in only the first three weeks of each sales period. so that the carryover effect of the campaign used in a sales period to the next sales period would be minimized. Table lists the campaigns used in the sales periods. To compare the effectiveness of advertising campaigns A, B, and C, we define two dummy variables. Specically, we define the dummy variable 03 to equal 1 if campaign B is used in a sales period and 0 otherwise. Furthermore, we dene the dummy variable Dc to equal 1 if campaign C is used in a sales period and 0 othenNise. Table presents the JMP output of a regression analysis of the Fresh demand data by using the model Historical Data Concerning Demand for Fresh Detergent Average Advertising Sales Price for Industry Expenditure Demand Period Fresh, X1 Price, X2 for Fresh, X3 for Fresh, y 1 3.99 3.87 5.55 7.33 2 3.75 4.04 6.73 8.56 3 3.72 4.34 7.22 9.27 4 3.74 3.70 5.51 7.51 5 3.67 3.82 7.02 9.34 6 3.64 3.81 6.59 8.29 7 3.61 3.74 6.71 8.77 8 3.84 3.81 5.27 7.87 9 3.82 3.67 5.27 7.10 10 3.89 4.04 6.01 8.02 11 3.98 4.13 6.54 7.84 12 3.99 4.02 6.28 8.10 13 3.72 4.18 7.09 9.16 14 3.76 4.29 6.95 8.87 15 3.72 4.14 6.89 8.92 16 3.80 4.11 6.85 8.87 17 3.79 4.25 7.13 9.21 Historical Data Concerning Demand for Fresh Detergent Average Advertising Sales Price for Industry Expenditure Demand Period Fresh, X1 Price, X2 for Fresh, x3 for Fresh, y 3.99 3. 87 5.55 7.33 3.75 4. 04 6. 73 8.56 3.72 4. 34 7.22 9. 27 3.74 3.70 5.51 7.51 3. 67 3. 82 7. 02 9. 34 35 0 VOUTAWNY 3. 64 3. 81 6.59 8. 29 3. 61 3.74 6. 71 8. 77 3. 84 3. 81 5.27 7. 87 3. 82 3. 67 5.27 7. 10 3.89 4. 04 6. 01 8. 02 3. 98 4. 13 6. 54 7.84 12 3.99 4. 02 6. 28 8. 10 13 3.72 4. 18 7. 09 9. 16 14 3. 76 4. 29 6. 95 8. 87 15 3.72 4. 14 6. 89 8. 92 16 3.80 4. 11 6. 85 8. 87 17 3.79 4. 25 7. 13 9. 21 18 3. 83 4. 38 7.02 9. 07 19 3. 79 4. 12 6. 82 8. 72 20 3.83 3.72 6.57 7.92 21 3 . 86 3.75 6. 23 7. 62 22 3.77 3. 62 6. 02 7. 28 23 3. 76 3.95 6.57 8. 01 24 3. 58 3.69 7.02 8.57 25 3.69 4. 17 6. 88 8. 77 26 3. 64 4. 24 6. 81 9. 29 27 3.71 3. 61 6.54 8. 20 28 3.75 3.70 5. 70 7. 66 29 3. 80 3.83 5. 85 7. 92 30 3.75 4. 25 6. 83 9. 25Advertising Campaigns Used by Enter prise Industries Sales Advertising Period Campaign nnwnaDDDDnWWDwww>nn>nunn> >Www 28 30 Summary of Fit RSquare 0. 945798 RSquare Adj 0. 934505 Root Mean Square Error 0. 17458 Mean of Response 8. 382667 Observations (or Sum Wgts) 30Summary of Fit RSquare 0. 945798 RSquare Adj 0. 934505 Root Mean Square Error 0. 17458 Mean of Response 8. 382667 Observations (or Sum Wgts) 30 Analysis of Variance Sum of Mean Source DF Squares Square F Ratio Model 5 12. 764512 2. 55290 83. 7569 Error 24 0. 731518 0. 03048 Prob > F C. Total 29 13. 496030 <. term estimate std error t ratio prob> | t| Lower 95% Upper 95% Intercept 8. 892705 1. 643365 5. 41
Step by Step Solution
There are 3 Steps involved in it
Step: 1
Get Instant Access to Expert-Tailored Solutions
See step-by-step solutions with expert insights and AI powered tools for academic success
Step: 2
Step: 3
Ace Your Homework with AI
Get the answers you need in no time with our AI-driven, step-by-step assistance