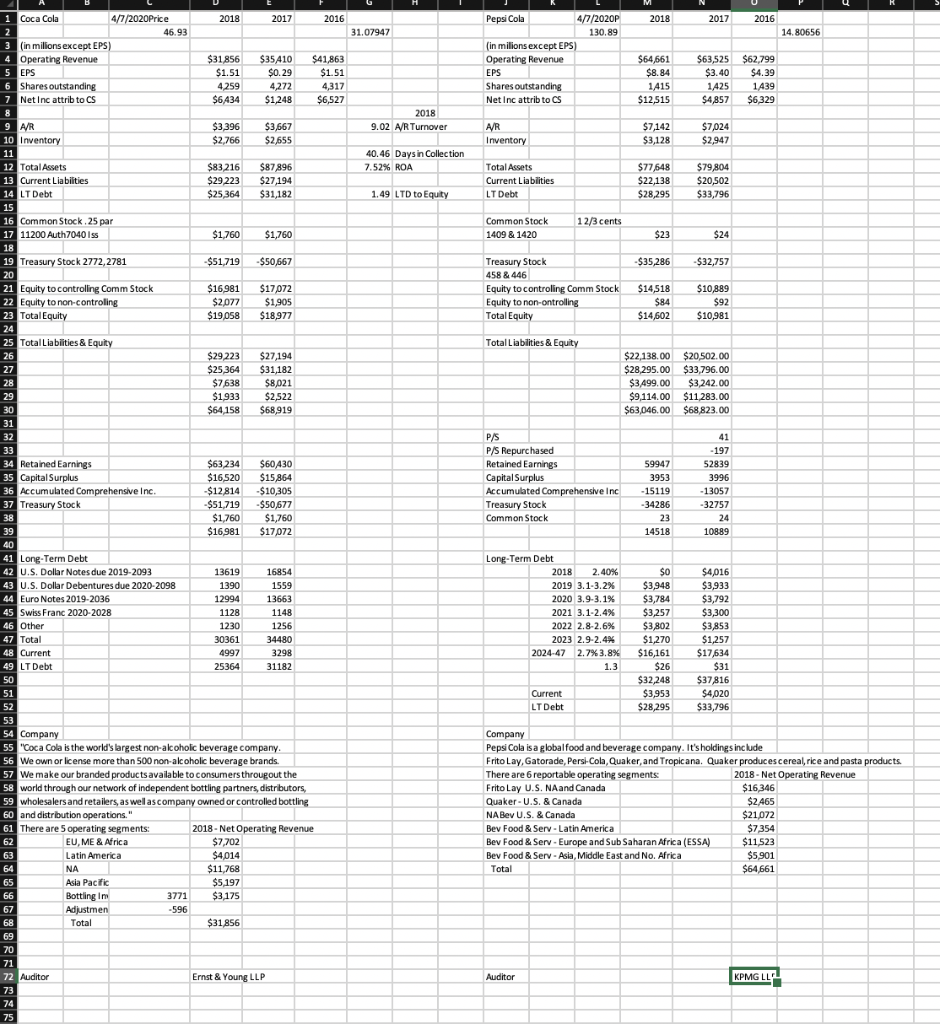
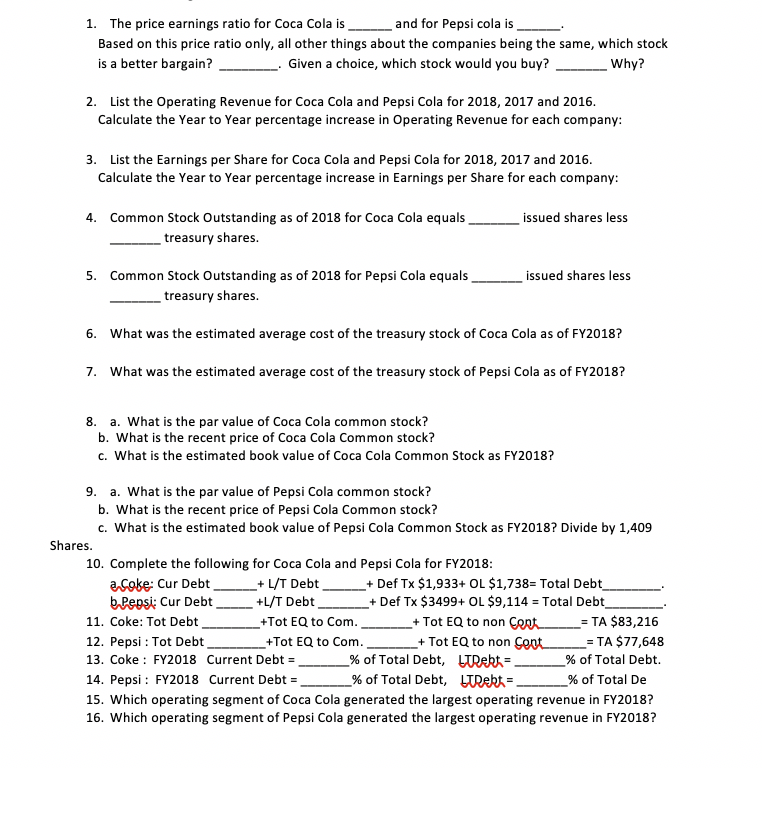
1 Coca Cola 4/7/2020Price 2018 2017 2016 2018 2017 2016 2 16.93 31.07947 14. 80656 3 (in milions except EPS) 4 Operating Revenue 5 EPS 6 Shares outstanding 7 Net Inc attrib to CS $31856 $1.51 4259 $6434 $35410 $0.29 4,272 $1,248 $41,863 $1.51 4317 $6,527 Pepsi Cola 477/2020P 130.89 (in milions except EPS) Operating Revenue EPS Shares outstanding Net Inc attrib to CS $64,661 $8.84 1415 $12,515 $63,525 $3.40 1,425 $4,857 $62,799 $4.39 1439 $6,329 9 AVR 2018 9.02 A/R Turnover $3,396 $2,766 $3,667 $2655 AVR Inventory $7,142 $3,128 $7,024 $2,947 10 Inventory 11 12 Total Assets 13 Current Liabilities 14 LT Debt 40.46 Days in Collection 7.52% ROA $83 216 $29 223 $25,364 $87896 $27,194 $31,182 Total Assets Current Liabilities LT Debt $77,648 $22,138 $28,295 $79,804 $20,502 $33,796 1.49 LTD to Equity 1 23 cents Common Stock 1409 & 1420 $1,760 $1,760 $23 $24 $51 719 $50,667 -$35,286 $32,757 16 Common Stock. 25 par 17 11200 Auth7040 Iss 18 19 Treasury Stock 2772,2781 20 21 Equity to controlling Comm Stock 22 Equity to non-controling 23 Total Equity $16,981 $2077 $19.058 $17,072 $1,905 $18,977 Treasury Stock 458 & 446 Equity to controling Comm Stock Equity to non-ontrolling Total Equity $14,518 $84 $14,602 $10,889 $92 $10,981 25 Total Liabilities & Equity Total Liabilities & Equity $29.223 $25,364 $7638 $1933 $64,158 $27,194 $31,182 $8,021 $2,522 $68,919 $22,138.00 $28,295.00 $3499.00 $9,114.00 $63,046.00 $20,502.00 $33,796.00 $3,242.00 $11283.00 $68,823.00 PS 41 34 Retained Earnings 35 Capital Surplus 36 Accumulated Comprehensive Inc. 37 Treasury Stock $63 234 $16,520 $12814 -$51,719 $1,760 $16,981 $60,430 $15,864 $10,305 -$50,677 $1,760 $17,072 P/S Repurchased Retained Earnings Capital Surplus Accumulated Comprehensive Inc Treasury Stock Common Stock 59947 3953 -15119 -34286 23 14518 -197 52839 3996 -13057 -32757 24 10889 41 Long-Term Debt 42 U.S. Dollar Notes due 2019-2093 43 U.S. Dollar Debentures due 2020-2098 44 Euro Notes 2019-2036 45 Swiss Franc 2020-2028 46 Other 47 Total 48 Current 49 LT Debt 13619 1390 12994 1128 1230 30361 4997 25364 16854 1559 13663 1148 1256 34480 3298 31182 Long-Term Debt 2018 2.40% 2019 3.1-3.2% 2020 3.9-3.1% 2021 3.1-2.4% 2022 2.8-2.6% 2023 2.9-2.4% 2024-47 2.7% 3.8% 1.3 $0 $3,948 $3,784 $3,257 $3,802 $1,270 $16,161 $26 $32,248 $3,953 $28,295 $4,016 $3,933 $3,792 $3,300 $3,853 $1,257 $17,634 $31 $37,816 $4,020 $33,796 Qurrent LT Debt 54 Company 55 "Coca Cola is the world's largest non-alcoholic beverage company. 56 We own or license more than 500 non-alcoholic beverage brands. 57 We make our branded products available to consumers througout the 58 world through our network of independent bottling partners, distributors, 59 wholesalers and retailers, as well as company owned or controlled bottling 60 and distribution operations." 61 There are 5 operating segments: 2018 - Net Operating Revenue EU, ME & Africa $7,702 Latin America $4,014 NA $11,768 Asia Pacific $5,197 Bottling Im 3771 $3.175 Adjustmen 596 Total $31856 Company Pepsi Cola is a globalfood and beverage company. It's holdings include Frito Lay, Gatorade, Persi-Cola, Quaker, and Tropicana. Quaker produces cereal, rice and pasta products. There are 6 reportable operating segments: 2018 - Net Operating Revenue Frito Lay U.S. NAand Canada $16,346 Quaker-U.S. & Canada $2465 NA Bev U.S. & Canada $21072 Bev Food & Serv - Latin America $7354 Bev Food & Serv - Europe and Sub Saharan Africa (ESSA) $11,523 Bev Food & Serv - Asia, Middle East and No. Africa $5,901 Total $64661 &&9a Sa 72 Auditor Ernst & Young LLP Auditor KPMG LLC 1. The price earnings ratio for Coca Cola is ____ and for Pepsi cola is Based on this price ratio only, all other things about the companies being the same, which stock is a better bargain? Given a choice, which stock would you buy? _______ Why? 2. List the Operating Revenue for Coca Cola and Pepsi Cola for 2018, 2017 and 2016. Calculate the Year to Year percentage increase in Operating Revenue for each company: 3. List the Earnings per Share for Coca Cola and Pepsi Cola for 2018, 2017 and 2016. Calculate the Year to Year percentage increase in Earnings per Share for each company: issued shares less 4. Common Stock Outstanding as of 2018 for Coca Cola equals _treasury shares. 5. Common Stock Outstanding as of 2018 for Pepsi Cola equals ______ issued shares less _treasury shares. 6. What was the estimated average cost of the treasury stock of Coca Cola as of FY2018? 7. What was the estimated average cost of the treasury stock of Pepsi Cola as of FY2018? b. What is the recent price of Coca Cola Common stock? c. What is the estimated book value of Coca Cola Common Stock as FY2018? 9. a. What is the par value of Pepsi Cola common stock? b. What is the recent price of Pepsi Cola Common stock? c. What is the estimated book value of Pepsi Cola Common Stock as FY2018? Divide by 1,409 Shares. 10. Complete the following for Coca Cola and Pepsi Cola for FY2018: a Coke: Cur Debt_ _+L/T Debt_ _+ Def Tx $1,933+ OL $1,738= Total Debt_ b. Pepsi: Cur Debt _____ +L/T Debt __ _+ Def Tx $3499+ OL $9,114 = Total Debt 11. Coke: Tot Debt ______+Tot EQ to Com. + Tot EQ to non cont = TA $83,216 12. Pepsi : Tot Debt _+Tot EQ to Com. ___ + Tot EQ to non Cont _= TA $77,648 13. Coke : FY2018 Current Debt = _______% of Total Debt, trebt = ______% of Total Debt. 14. Pepsi : FY2018 Current Debt = ______% of Total Debt, trekt = _______% of Total De 15. Which operating segment of Coca Cola generated the largest operating revenue in FY2018? 16. Which operating segment of Pepsi Cola generated the largest operating revenue in FY2018? 1 Coca Cola 4/7/2020Price 2018 2017 2016 2018 2017 2016 2 16.93 31.07947 14. 80656 3 (in milions except EPS) 4 Operating Revenue 5 EPS 6 Shares outstanding 7 Net Inc attrib to CS $31856 $1.51 4259 $6434 $35410 $0.29 4,272 $1,248 $41,863 $1.51 4317 $6,527 Pepsi Cola 477/2020P 130.89 (in milions except EPS) Operating Revenue EPS Shares outstanding Net Inc attrib to CS $64,661 $8.84 1415 $12,515 $63,525 $3.40 1,425 $4,857 $62,799 $4.39 1439 $6,329 9 AVR 2018 9.02 A/R Turnover $3,396 $2,766 $3,667 $2655 AVR Inventory $7,142 $3,128 $7,024 $2,947 10 Inventory 11 12 Total Assets 13 Current Liabilities 14 LT Debt 40.46 Days in Collection 7.52% ROA $83 216 $29 223 $25,364 $87896 $27,194 $31,182 Total Assets Current Liabilities LT Debt $77,648 $22,138 $28,295 $79,804 $20,502 $33,796 1.49 LTD to Equity 1 23 cents Common Stock 1409 & 1420 $1,760 $1,760 $23 $24 $51 719 $50,667 -$35,286 $32,757 16 Common Stock. 25 par 17 11200 Auth7040 Iss 18 19 Treasury Stock 2772,2781 20 21 Equity to controlling Comm Stock 22 Equity to non-controling 23 Total Equity $16,981 $2077 $19.058 $17,072 $1,905 $18,977 Treasury Stock 458 & 446 Equity to controling Comm Stock Equity to non-ontrolling Total Equity $14,518 $84 $14,602 $10,889 $92 $10,981 25 Total Liabilities & Equity Total Liabilities & Equity $29.223 $25,364 $7638 $1933 $64,158 $27,194 $31,182 $8,021 $2,522 $68,919 $22,138.00 $28,295.00 $3499.00 $9,114.00 $63,046.00 $20,502.00 $33,796.00 $3,242.00 $11283.00 $68,823.00 PS 41 34 Retained Earnings 35 Capital Surplus 36 Accumulated Comprehensive Inc. 37 Treasury Stock $63 234 $16,520 $12814 -$51,719 $1,760 $16,981 $60,430 $15,864 $10,305 -$50,677 $1,760 $17,072 P/S Repurchased Retained Earnings Capital Surplus Accumulated Comprehensive Inc Treasury Stock Common Stock 59947 3953 -15119 -34286 23 14518 -197 52839 3996 -13057 -32757 24 10889 41 Long-Term Debt 42 U.S. Dollar Notes due 2019-2093 43 U.S. Dollar Debentures due 2020-2098 44 Euro Notes 2019-2036 45 Swiss Franc 2020-2028 46 Other 47 Total 48 Current 49 LT Debt 13619 1390 12994 1128 1230 30361 4997 25364 16854 1559 13663 1148 1256 34480 3298 31182 Long-Term Debt 2018 2.40% 2019 3.1-3.2% 2020 3.9-3.1% 2021 3.1-2.4% 2022 2.8-2.6% 2023 2.9-2.4% 2024-47 2.7% 3.8% 1.3 $0 $3,948 $3,784 $3,257 $3,802 $1,270 $16,161 $26 $32,248 $3,953 $28,295 $4,016 $3,933 $3,792 $3,300 $3,853 $1,257 $17,634 $31 $37,816 $4,020 $33,796 Qurrent LT Debt 54 Company 55 "Coca Cola is the world's largest non-alcoholic beverage company. 56 We own or license more than 500 non-alcoholic beverage brands. 57 We make our branded products available to consumers througout the 58 world through our network of independent bottling partners, distributors, 59 wholesalers and retailers, as well as company owned or controlled bottling 60 and distribution operations." 61 There are 5 operating segments: 2018 - Net Operating Revenue EU, ME & Africa $7,702 Latin America $4,014 NA $11,768 Asia Pacific $5,197 Bottling Im 3771 $3.175 Adjustmen 596 Total $31856 Company Pepsi Cola is a globalfood and beverage company. It's holdings include Frito Lay, Gatorade, Persi-Cola, Quaker, and Tropicana. Quaker produces cereal, rice and pasta products. There are 6 reportable operating segments: 2018 - Net Operating Revenue Frito Lay U.S. NAand Canada $16,346 Quaker-U.S. & Canada $2465 NA Bev U.S. & Canada $21072 Bev Food & Serv - Latin America $7354 Bev Food & Serv - Europe and Sub Saharan Africa (ESSA) $11,523 Bev Food & Serv - Asia, Middle East and No. Africa $5,901 Total $64661 &&9a Sa 72 Auditor Ernst & Young LLP Auditor KPMG LLC 1. The price earnings ratio for Coca Cola is ____ and for Pepsi cola is Based on this price ratio only, all other things about the companies being the same, which stock is a better bargain? Given a choice, which stock would you buy? _______ Why? 2. List the Operating Revenue for Coca Cola and Pepsi Cola for 2018, 2017 and 2016. Calculate the Year to Year percentage increase in Operating Revenue for each company: 3. List the Earnings per Share for Coca Cola and Pepsi Cola for 2018, 2017 and 2016. Calculate the Year to Year percentage increase in Earnings per Share for each company: issued shares less 4. Common Stock Outstanding as of 2018 for Coca Cola equals _treasury shares. 5. Common Stock Outstanding as of 2018 for Pepsi Cola equals ______ issued shares less _treasury shares. 6. What was the estimated average cost of the treasury stock of Coca Cola as of FY2018? 7. What was the estimated average cost of the treasury stock of Pepsi Cola as of FY2018? b. What is the recent price of Coca Cola Common stock? c. What is the estimated book value of Coca Cola Common Stock as FY2018? 9. a. What is the par value of Pepsi Cola common stock? b. What is the recent price of Pepsi Cola Common stock? c. What is the estimated book value of Pepsi Cola Common Stock as FY2018? Divide by 1,409 Shares. 10. Complete the following for Coca Cola and Pepsi Cola for FY2018: a Coke: Cur Debt_ _+L/T Debt_ _+ Def Tx $1,933+ OL $1,738= Total Debt_ b. Pepsi: Cur Debt _____ +L/T Debt __ _+ Def Tx $3499+ OL $9,114 = Total Debt 11. Coke: Tot Debt ______+Tot EQ to Com. + Tot EQ to non cont = TA $83,216 12. Pepsi : Tot Debt _+Tot EQ to Com. ___ + Tot EQ to non Cont _= TA $77,648 13. Coke : FY2018 Current Debt = _______% of Total Debt, trebt = ______% of Total Debt. 14. Pepsi : FY2018 Current Debt = ______% of Total Debt, trekt = _______% of Total De 15. Which operating segment of Coca Cola generated the largest operating revenue in FY2018? 16. Which operating segment of Pepsi Cola generated the largest operating revenue in FY2018