1) Compare the relative external market positions of the focal firm and the key competitor at the end of Y14.
2) Plot the internal and external resource positions [see figure 10.3] at the end of Y14.
Note in C, D, and E above you are analyzing relative positions at the end of Y14. Essentially, you are treating Y11-Y14 as historical data. You will use this historical data to predict the behavior of your key competitor for Y15-Y16 as described below.
3) Predict the future competitive behavior of the key competitor for Y15-Y16 using the competitor analysis framework (figure 10.5) proposed by the authors: beliefs (industry, competitors, and self), competitive intent and goals (corporate, business, and functional), and past competitive actions.
4) Compare and contrast your predictions of the key competitors behavior for Y15-Y16 in item F above with what the key competitor actually did in Y15-Y16.
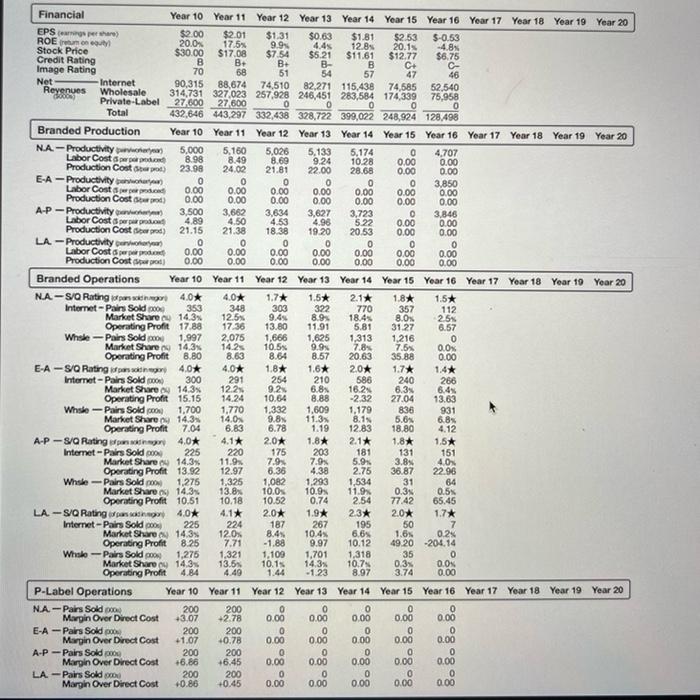
Financial Year 10 Year 11 Year 12 Year 13 Year 14 Year 15 Year 16 Year 17 Year 18 Year 19 Year 20 EPS (Opera) ROE $2.00 $2.01 $1.31 $0.63 $1.81 $2.53 5-0.53 20.0% 17.5% 9.9% 4.45 12.8% 20.1% -4.8% Stock Price $30.00 $17.08 Credit Rating $7.54 $5.21 $11.61 $12.77 $6.75 B BH B B- B C+ Image Rating 70 C- 68 51 54 57 47 46 Net Internet 90.315 88,674 74,510 Revenues 82,271 115,438 Wholesale 74,585 52,540 3000 314,731 337,023 257,928 246,451 283,584 174,339 75,958 Private Label 27.600 27.600 0 0 0 Total 432,646 443,297 332,438 328,722 399,022 248,924 128,498 Branded Production Year 10 Year 11 Year 12 Year 13 Year 14 Year 15 Year 16 Year 17 Year 18 Year 19 Year 20 NA-Productivity by 5.000 5,160 5.026 Labor Costwo 5.133 5.174 0 8.98 4.707 8.49 8.69 9.24 Production Control 10.28 0.00 0.00 23.98 24.02 21.81 22.00 28.68 0.00 0.00 E-A-Productivity 0 0 0 0 0 Labor Cost od o 3,850 0.00 0.00 0.00 0.00 0.00 0.00 Production Costo) 0.00 0.00 0.00 0.00 0.00 0.00 0.00 0.00 A-P-Productivity 3,500 3,662 3,634 3,627 3,723 0 3,846 Labor Cost powodu 4.89 4,50 4.53 4.96 522 0.00 0.00 Production Costerad) 21.15 21.38 8.38 19.20 20.53 0.00 0.00 LA-Productivity by 0 0 0 0 0 0 0 Labor Costa 0.00 0.00 0.00 0.00 0.00 0.00 0.00 Production Costo 0.00 0.00 0.00 0.00 0.00 0.00 0.00 Branded Operations Year 10 Year 11 Year 12 Year 13 Year 14 Year 15 Year 16 Year 17 Year 18 Year 10 Year 20 NA-SV Rating for the 4.0* 4.0* 1.7* 1.5* 2.1* 1.8* 1.5* Internet-Pairs Sold 200 353 348 303 322 770 357 112 Market Share 14.3% 12.5% 9.45 8.9% 18.45 8.0% 25% Operating Profit 17.88 17.36 13.80 11.91 5.81 31.27 6.57 Whale-Pairs Sold 1.997 2,075 1,666 1.625 1,313 1,216 0 Market Share 14.3% 14.2 10.5% 9.9 7.5% 0.0% Operating Profit 8.80 8.63 8.64 8.57 20.63 35.88 0.00 E-A-SQ Rating 4.0* 40* 1.8* 1.6* 20* 1.7* 1.4% Internet Pairs Sold 300 291 254 210 586 240 266 Market Share 14.3% 122 9.25 6.8 16.2% 6.3% 6.4% Operating Profit 15.15 14.24 10.64 8.88 -2.32 27.04 13.63 Whale-Pairs Soldo 1,700 1,770 1.332 1.609 1,179 836 931 Market Share 14.3 14.0 9.8% 11.3% 8.1 5.6% 6.8% Operating Profit 7.04 6.83 6.78 1.19 12.83 18.80 4.12 A-P-SQ Rating 4.0* 4.1* 20* 1.8* 2.1% 1.8* 1.5* Internet -Pairs Sold 200 225 220 175 203 181 131 151 Market Share 14.3% 11.95 7.95 7.9 5.9% 3.8% 40% Operating Profit 13.92 12.97 6.36 4.38 2.75 36.87 22.96 Whale-Pairs Soldo 1,275 1,325 1,082 1,293 1.534 31 64 Market Share 14.3% 13.8% 10.ON 10.9 11.9 0.3% 0.5% Operating Profit 10.51 10.18 10.52 0.74 2.54 77.42 65.45 LA-SIQ Rating pasang 4,0* 4.1* 20* 1.9* 23* 2.0* 1.7* Internet-Pairs Sold 2004 225 187 267 195 50 7 Market Share 14.3% 12.0 8.45 10.45 6.6% 1.6% 0.2% Operating Profit 8.25 7.71 -1.88 9.97 10.12 49.20 -204.14 Whisko-Pairs Sold 200 1,275 1,321 1,109 1,701 1,318 35 0 Market Share 14.3% 13.5 10.15 14,3 10.7 0.3% 0.0 Operating Profit 4.49 -1.23 8.97 3.74 0.00 P-Label Operations Year 10 Year 11 Year 12 Year 13 Year 14 Year 15 Year 16 Year 17 Year 18 Year 19 Year 20 NA --Pairs Sold 200 200 0 0 0 0 Margin Over Direct Cost 13.07 +2.78 0.00 0.00 0.00 0.00 E-A-Pairs Soldo 200 200 0 0 0 0 Margin Over Direct Cost -1.07 0.78 0.00 0.00 0.00 0.00 0.00 A-P-Pairs Sold 200 200 0 0 0 0 0 Margin Over Direct Cost *6.86 +6.45 0.00 0.00 0.00 0.00 LA-Pairs Sold 200 0 0 0 0 0 Margin Over Direct Cost +0.86 +0.45 0.00 0.00 0.00 0.00 7.85 224 4.84 0 0 0.00 200 0.00 Financial Year 10 Year 11 Year 12 Year 13 Year 14 Year 15 Year 16 Year 17 Year 18 Year 19 Year 20 EPS (Opera) ROE $2.00 $2.01 $1.31 $0.63 $1.81 $2.53 5-0.53 20.0% 17.5% 9.9% 4.45 12.8% 20.1% -4.8% Stock Price $30.00 $17.08 Credit Rating $7.54 $5.21 $11.61 $12.77 $6.75 B BH B B- B C+ Image Rating 70 C- 68 51 54 57 47 46 Net Internet 90.315 88,674 74,510 Revenues 82,271 115,438 Wholesale 74,585 52,540 3000 314,731 337,023 257,928 246,451 283,584 174,339 75,958 Private Label 27.600 27.600 0 0 0 Total 432,646 443,297 332,438 328,722 399,022 248,924 128,498 Branded Production Year 10 Year 11 Year 12 Year 13 Year 14 Year 15 Year 16 Year 17 Year 18 Year 19 Year 20 NA-Productivity by 5.000 5,160 5.026 Labor Costwo 5.133 5.174 0 8.98 4.707 8.49 8.69 9.24 Production Control 10.28 0.00 0.00 23.98 24.02 21.81 22.00 28.68 0.00 0.00 E-A-Productivity 0 0 0 0 0 Labor Cost od o 3,850 0.00 0.00 0.00 0.00 0.00 0.00 Production Costo) 0.00 0.00 0.00 0.00 0.00 0.00 0.00 0.00 A-P-Productivity 3,500 3,662 3,634 3,627 3,723 0 3,846 Labor Cost powodu 4.89 4,50 4.53 4.96 522 0.00 0.00 Production Costerad) 21.15 21.38 8.38 19.20 20.53 0.00 0.00 LA-Productivity by 0 0 0 0 0 0 0 Labor Costa 0.00 0.00 0.00 0.00 0.00 0.00 0.00 Production Costo 0.00 0.00 0.00 0.00 0.00 0.00 0.00 Branded Operations Year 10 Year 11 Year 12 Year 13 Year 14 Year 15 Year 16 Year 17 Year 18 Year 10 Year 20 NA-SV Rating for the 4.0* 4.0* 1.7* 1.5* 2.1* 1.8* 1.5* Internet-Pairs Sold 200 353 348 303 322 770 357 112 Market Share 14.3% 12.5% 9.45 8.9% 18.45 8.0% 25% Operating Profit 17.88 17.36 13.80 11.91 5.81 31.27 6.57 Whale-Pairs Sold 1.997 2,075 1,666 1.625 1,313 1,216 0 Market Share 14.3% 14.2 10.5% 9.9 7.5% 0.0% Operating Profit 8.80 8.63 8.64 8.57 20.63 35.88 0.00 E-A-SQ Rating 4.0* 40* 1.8* 1.6* 20* 1.7* 1.4% Internet Pairs Sold 300 291 254 210 586 240 266 Market Share 14.3% 122 9.25 6.8 16.2% 6.3% 6.4% Operating Profit 15.15 14.24 10.64 8.88 -2.32 27.04 13.63 Whale-Pairs Soldo 1,700 1,770 1.332 1.609 1,179 836 931 Market Share 14.3 14.0 9.8% 11.3% 8.1 5.6% 6.8% Operating Profit 7.04 6.83 6.78 1.19 12.83 18.80 4.12 A-P-SQ Rating 4.0* 4.1* 20* 1.8* 2.1% 1.8* 1.5* Internet -Pairs Sold 200 225 220 175 203 181 131 151 Market Share 14.3% 11.95 7.95 7.9 5.9% 3.8% 40% Operating Profit 13.92 12.97 6.36 4.38 2.75 36.87 22.96 Whale-Pairs Soldo 1,275 1,325 1,082 1,293 1.534 31 64 Market Share 14.3% 13.8% 10.ON 10.9 11.9 0.3% 0.5% Operating Profit 10.51 10.18 10.52 0.74 2.54 77.42 65.45 LA-SIQ Rating pasang 4,0* 4.1* 20* 1.9* 23* 2.0* 1.7* Internet-Pairs Sold 2004 225 187 267 195 50 7 Market Share 14.3% 12.0 8.45 10.45 6.6% 1.6% 0.2% Operating Profit 8.25 7.71 -1.88 9.97 10.12 49.20 -204.14 Whisko-Pairs Sold 200 1,275 1,321 1,109 1,701 1,318 35 0 Market Share 14.3% 13.5 10.15 14,3 10.7 0.3% 0.0 Operating Profit 4.49 -1.23 8.97 3.74 0.00 P-Label Operations Year 10 Year 11 Year 12 Year 13 Year 14 Year 15 Year 16 Year 17 Year 18 Year 19 Year 20 NA --Pairs Sold 200 200 0 0 0 0 Margin Over Direct Cost 13.07 +2.78 0.00 0.00 0.00 0.00 E-A-Pairs Soldo 200 200 0 0 0 0 Margin Over Direct Cost -1.07 0.78 0.00 0.00 0.00 0.00 0.00 A-P-Pairs Sold 200 200 0 0 0 0 0 Margin Over Direct Cost *6.86 +6.45 0.00 0.00 0.00 0.00 LA-Pairs Sold 200 0 0 0 0 0 Margin Over Direct Cost +0.86 +0.45 0.00 0.00 0.00 0.00 7.85 224 4.84 0 0 0.00 200 0.00