Answered step by step
Verified Expert Solution
Question
1 Approved Answer
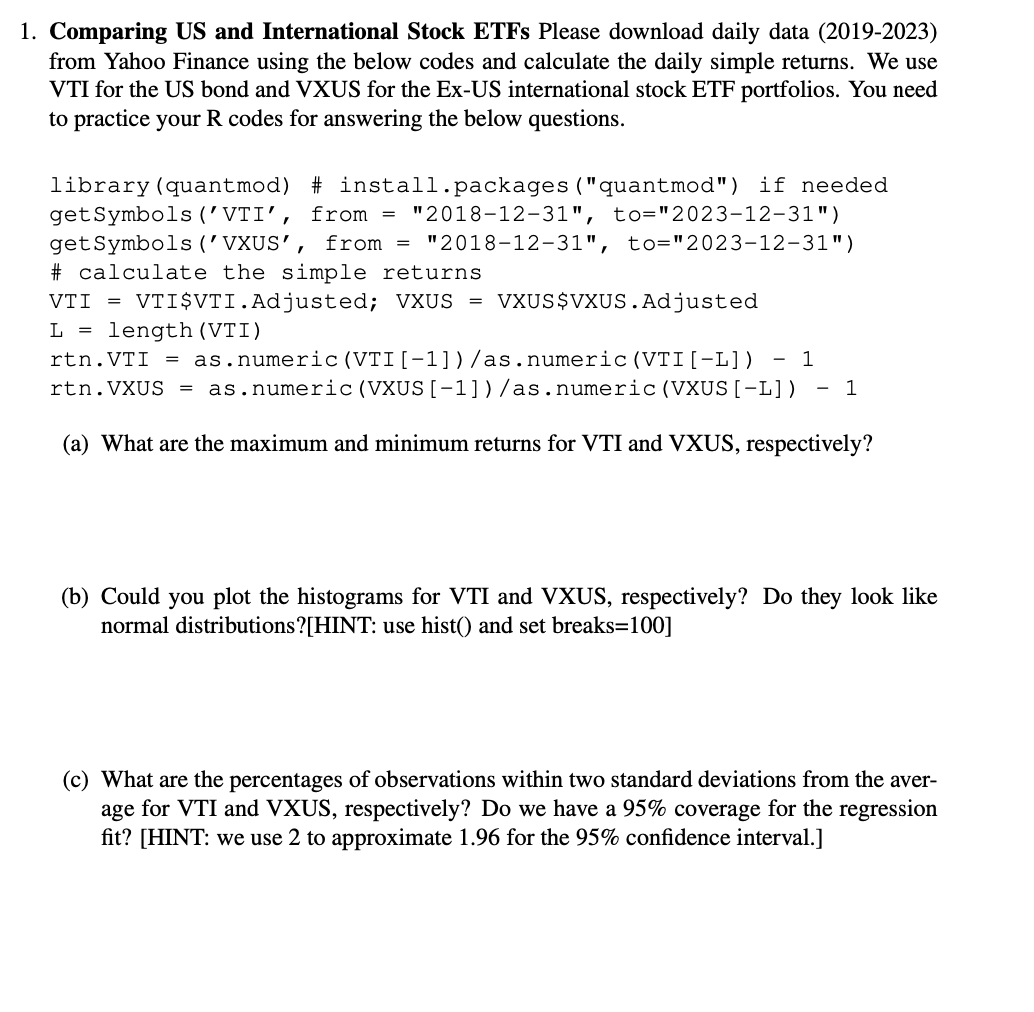
1. Comparing US and International Stock ETFs Please download daily data (2019-2023) from Yahoo Finance using the below codes and calculate the daily simple


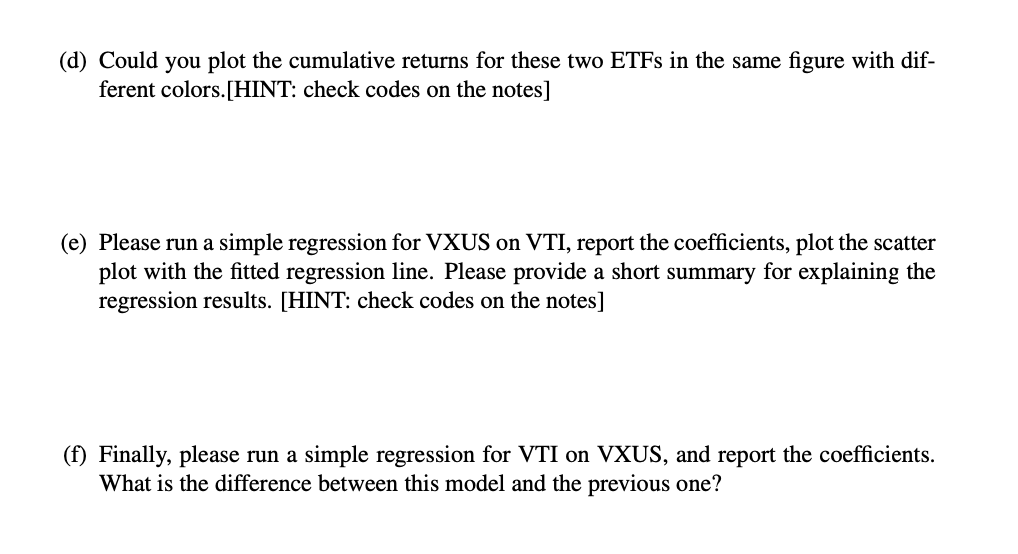
1. Comparing US and International Stock ETFs Please download daily data (2019-2023) from Yahoo Finance using the below codes and calculate the daily simple returns. We use VTI for the US bond and VXUS for the Ex-US international stock ETF portfolios. You need to practice your R codes for answering the below questions. = "2018-12-31", to="2023-12-31") library (quantmod) # install.packages ("quantmod") if needed get Symbols ('VTI', from get Symbols ('VXUS', from = "2018-12-31", to="2023-12-31") %23 calculate the simple returns VTI = VTI$VTI. Adjusted; VXUS L = length (VTI) = VXUS$VXUS. Adjusted rtn.VTI = as.numeric (VTI [-1])/as.numeric(VTI [-L]) - 1 rtn.VXUS = as.numeric (VXUS [-1])/as.numeric (VXUS [-L]) - 1 (a) What are the maximum and minimum returns for VTI and VXUS, respectively? (b) Could you plot the histograms for VTI and VXUS, respectively? Do they look like normal distributions? [HINT: use hist() and set breaks=100] (c) What are the percentages of observations within two standard deviations from the aver- age for VTI and VXUS, respectively? Do we have a 95% coverage for the regression fit? [HINT: we use 2 to approximate 1.96 for the 95% confidence interval.] (d) Could you plot the cumulative returns for these two ETFs in the same figure with dif- ferent colors. [HINT: check codes on the notes] (e) Please run a simple regression for VXUS on VTI, report the coefficients, plot the scatter plot with the fitted regression line. Please provide a short summary for explaining the regression results. [HINT: check codes on the notes] (f) Finally, please run a simple regression for VTI on VXUS, and report the coefficients. What is the difference between this model and the previous one?
Step by Step Solution
There are 3 Steps involved in it
Step: 1

Get Instant Access to Expert-Tailored Solutions
See step-by-step solutions with expert insights and AI powered tools for academic success
Step: 2

Step: 3

Ace Your Homework with AI
Get the answers you need in no time with our AI-driven, step-by-step assistance
Get Started


