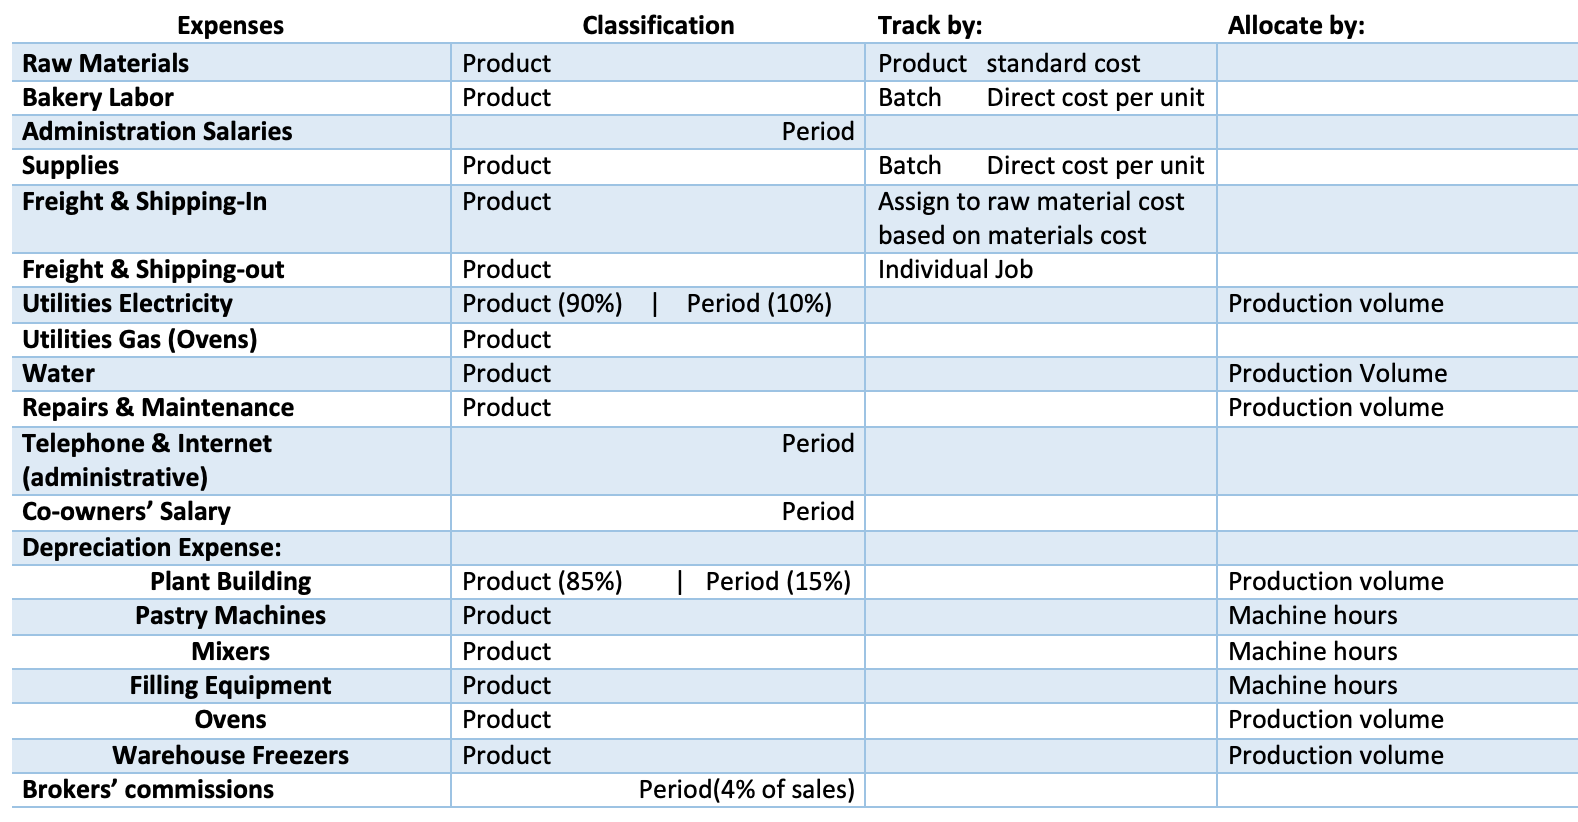
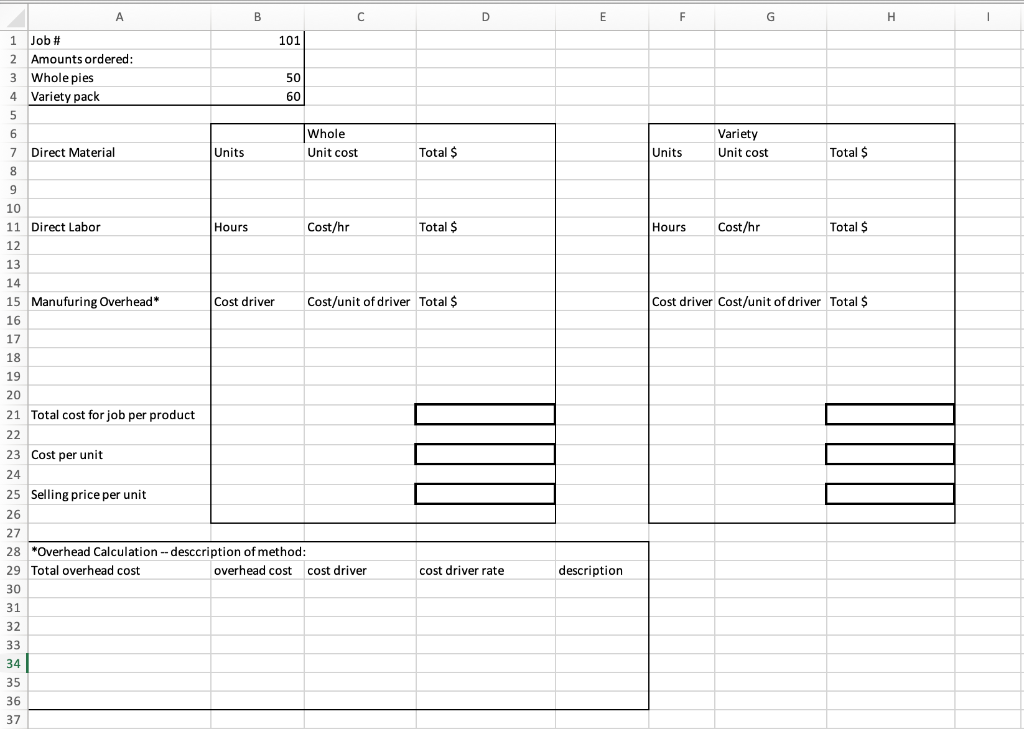
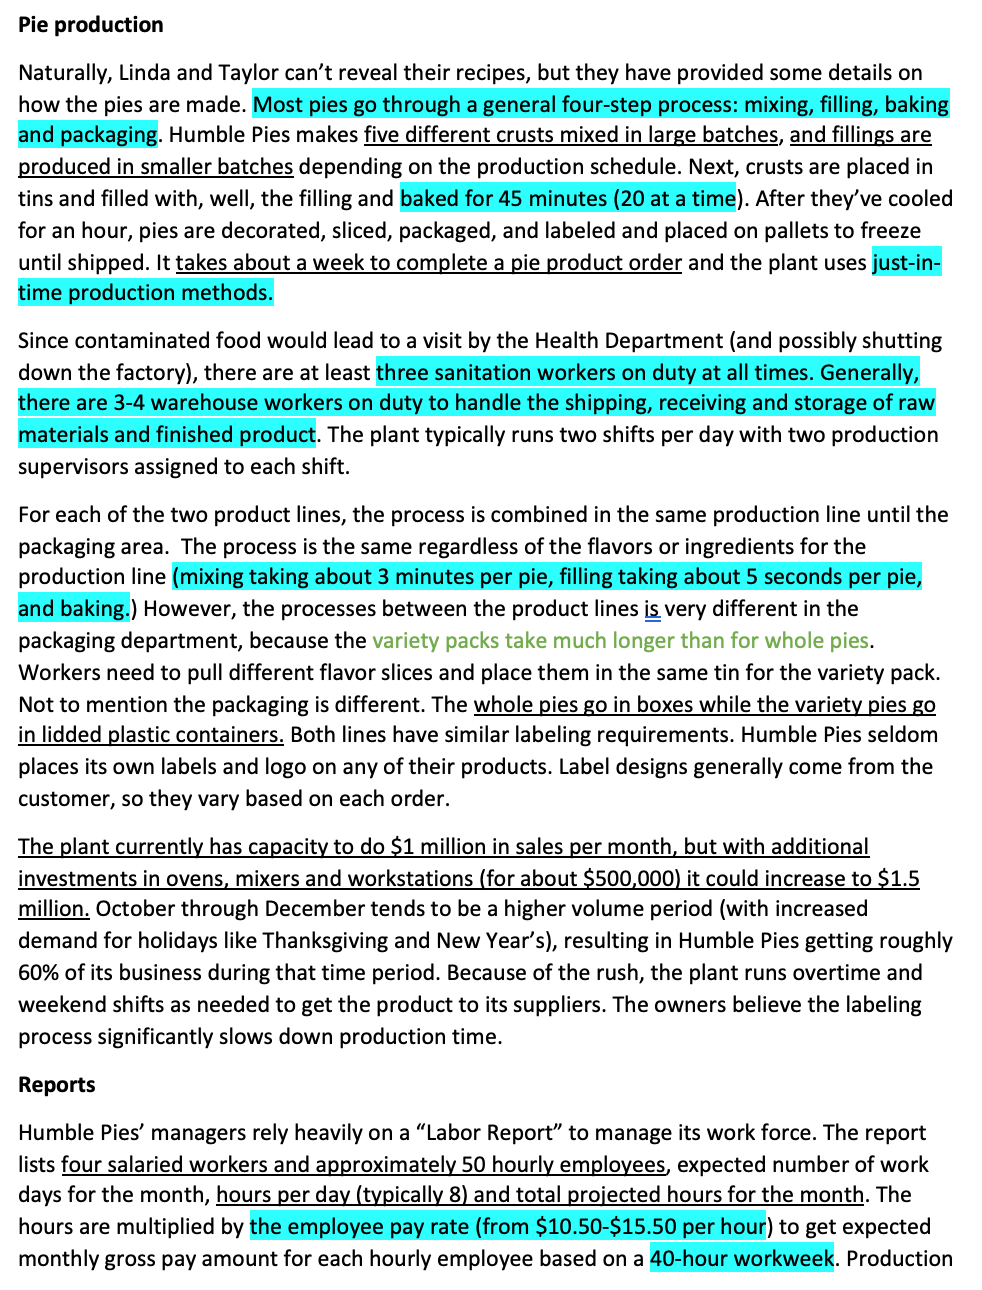
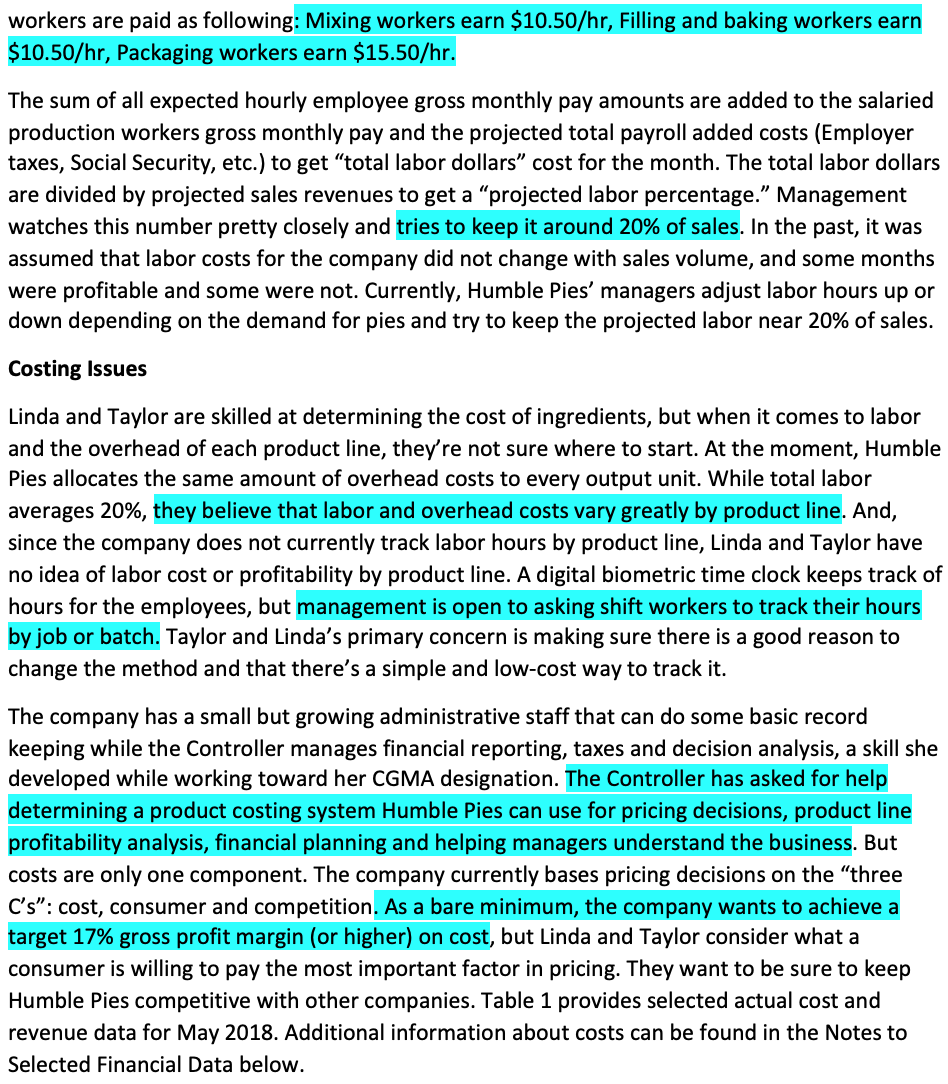
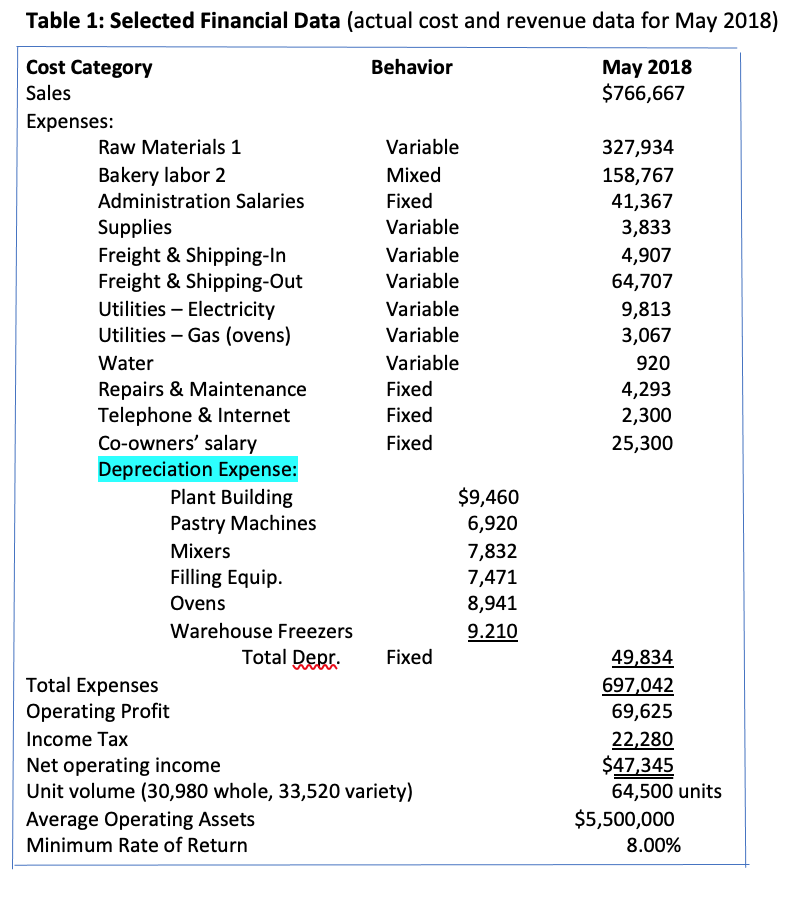
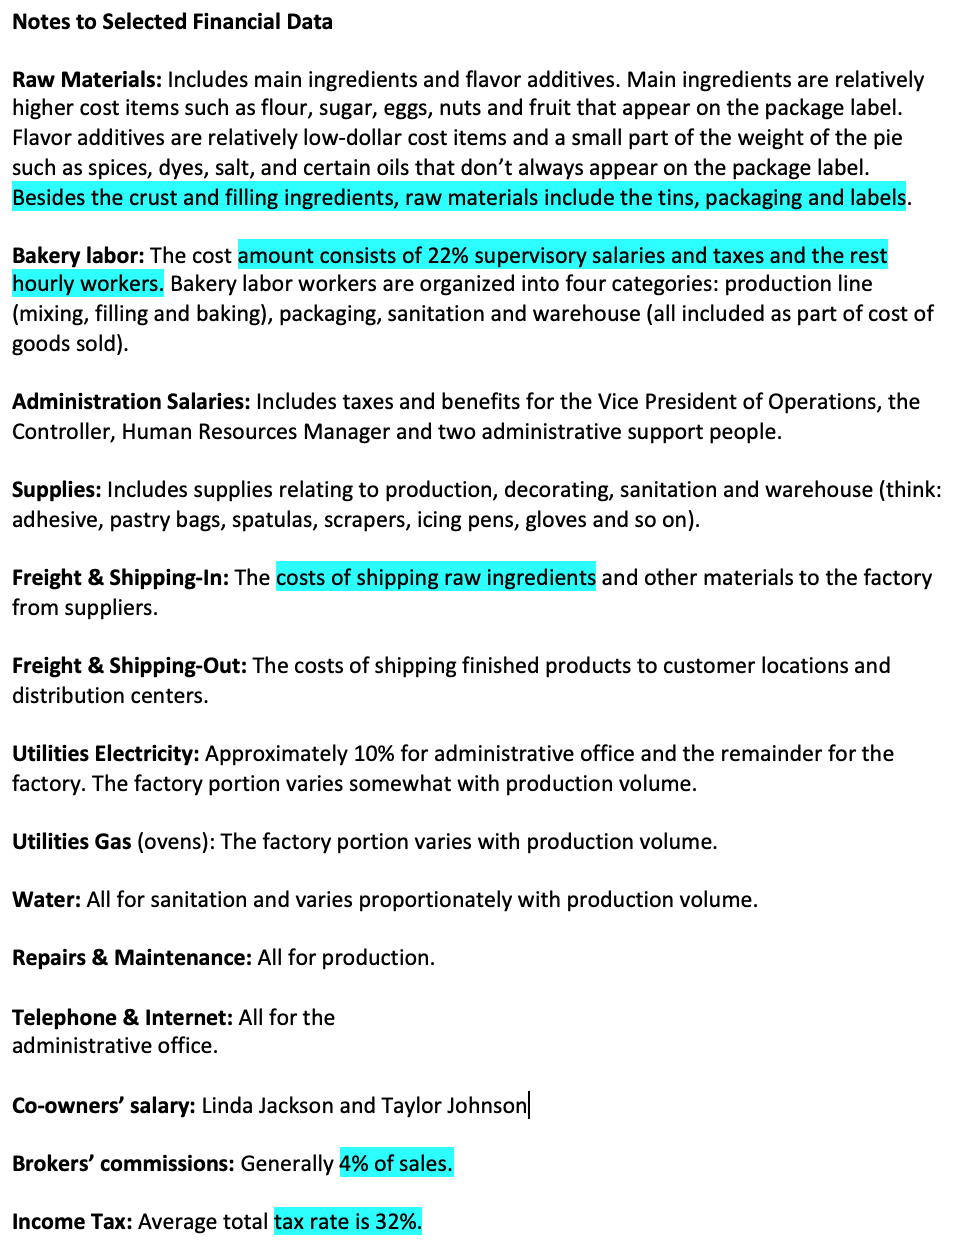
1) Complete an example job cost sheet using the methods you described in Table 2 . If you need to make assumptions in order to complete the sheet indicate on the sheet how the figures were estimated. (Job costing sheet is located below table 2.)
***Please read background information***
Table 2
--------------------------------------------------------------------------------------------------------------------------------------------------------------------------------------------
Background information:
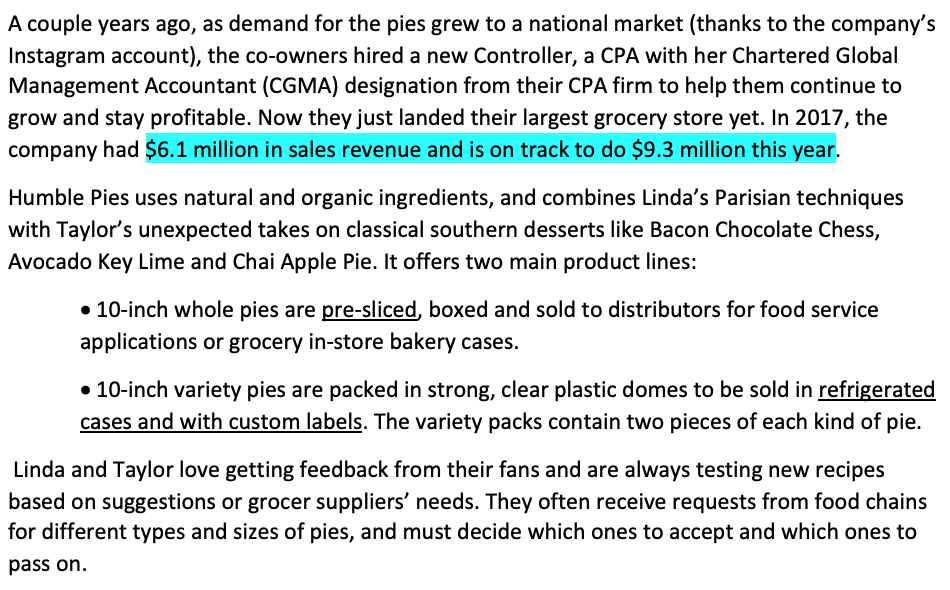
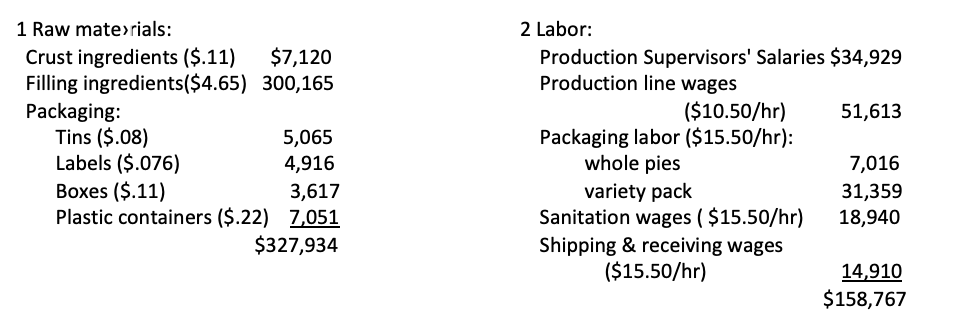
Classification Allocate by: Product Product Track by: Product standard cost Batch Direct cost per unit Expenses Raw Materials Bakery Labor Administration Salaries Supplies Freight & Shipping-In Period Product Product Batch Direct cost per unit Assign to raw material cost based on materials cost Individual Job Production volume Product Product (90%) | Period (10%) Product Product Product Period Production Volume Production volume Period Freight & Shipping-out Utilities Electricity Utilities Gas (Ovens) Water Repairs & Maintenance Telephone & Internet (administrative) Co-owners' Salary Depreciation Expense: Plant Building Pastry Machines Mixers Filling Equipment Ovens Warehouse Freezers Brokers' commissions | Period (15%) Product (85%) Product Product Product Product Product Production volume Machine hours Machine hours Machine hours Production volume Production volume Period(4% of sales) A B D E F H 101 50 60 Whole Unit cost Variety Unit cost Units Total $ Units Total $ 1 Job # 2 Amounts ordered: 3 Whole pies 4 Variety pack 5 5 6 7 Direct Material 8 9 9 10 11 Direct Labor 12 13 14 15 Manufuring Overhead* 16 17 18 Hours Cost/hr Total $ Hours Cost/hr Total $ Cost driver Cost/unit of driver Total $ Cost driver Cost/unit of driver Total $ 19 20 21 Total cost for job per product 22 23 Cost per unit 24 25 Selling price per unit 26 27 28 *Overhead Calculation -- description of method: 29 Total overhead cost overhead cost cost driver 30 31 32 33 34 35 36 37 cost driver rate description 1 Raw mate>rials: Crust ingredients ($.11) $7,120 Filling ingredients($4.65) 300,165 Packaging: Tins ($.08) 5,065 Labels ($.076) 4,916 Boxes ($.11) 3,617 Plastic containers ($.22) 7,051 $327,934 2 Labor: Production Supervisors' Salaries $34,929 Production line wages ($10.50/hr) 51,613 Packaging labor ($15.50/hr): whole pies 7,016 variety pack 31,359 Sanitation wages ( $15.50/hr) 18,940 Shipping & receiving wages ($15.50/hr) 14,910 $158,767 A couple years ago, as demand for the pies grew to a national market (thanks to the company's Instagram account), the co-owners hired a new Controller, a CPA with her Chartered Global Management Accountant (CGMA) designation from their CPA firm to help them continue to grow and stay profitable. Now they just landed their largest grocery store yet. In 2017, the company had $6.1 million in sales revenue and is on track to do $9.3 million this year. Humble Pies uses natural and organic ingredients, and combines Linda's Parisian techniques with Taylor's unexpected takes on classical southern desserts like Bacon Chocolate Chess, Avocado Key Lime and Chai Apple Pie. It offers two main product lines: 10-inch whole pies are pre-sliced, boxed and sold to distributors for food service applications or grocery in-store bakery cases. 10-inch variety pies are packed in strong, clear plastic domes to be sold in refrigerated cases and with custom labels. The variety packs contain two pieces of each kind of pie. Linda and Taylor love getting feedback from their fans and are always testing new recipes based on suggestions or grocer suppliers' needs. They often receive requests from food chains for different types and sizes of pies, and must decide which ones to accept and which ones to pass on. Pie production Naturally, Linda and Taylor can't reveal their recipes, but they have provided some details on how the pies are made. Most pies go through a general four-step process: mixing, filling, baking and packaging. Humble Pies makes five different crusts mixed in large batches, and fillings are produced in smaller batches depending on the production schedule. Next, crusts are placed in tins and filled with, well, the filling and baked for 45 minutes (20 at a time). After they've cooled for an hour, pies are decorated, sliced, packaged, and labeled and placed on pallets to freeze until shipped. It takes about a week to complete a pie product order and the plant uses just-in- time production methods. Since contaminated food would lead to a visit by the Health Department (and possibly shutting down the factory), there are at least three sanitation workers on duty at all times. Generally, there are 3-4 warehouse workers on duty to handle the shipping, receiving and storage of raw materials and finished product. The plant typically runs two shifts per day with two production supervisors assigned to each shift. For each of the two product lines, the process is combined in the same production line until the packaging area. The process is the same regardless of the flavors or ingredients for the production line (mixing taking about 3 minutes per pie, filling taking about 5 seconds per pie, and baking.) However, the processes between the product lines is very different in the packaging department, because the variety packs take much longer than for whole pies. Workers need to pull different flavor slices and place them in the same tin for the variety pack. Not to mention the packaging is different. The whole pies go in boxes while the variety pies go in lidded plastic containers. Both lines have similar labeling requirements. Humble Pies seldom places its own labels and logo on any of their products. Label designs generally come from the customer, so they vary based on each order. The plant currently has capacity to do $1 million in sales per month, but with additional investments in ovens, mixers and workstations (for about $500,000) it could increase to $1.5 million. October through December tends to be a higher volume period (with increased demand for holidays like Thanksgiving and New Year's), resulting in Humble Pies getting roughly 60% of its business during that time period. Because of the rush, the plant runs overtime and weekend shifts as needed to get the product to its suppliers. The owners believe the labeling process significantly slows down production time. Reports Humble Pies' managers rely heavily on a "Labor Report" to manage its work force. The report lists four salaried workers and approximately 50 hourly employees, expected number of work days for the month, hours per day (typically 8) and total projected hours for the month. The hours are multiplied by the employee pay rate (from $10.50-$15.50 per hour) to get expected monthly gross pay amount for each hourly employee based on a 40-hour workweek. Production workers are paid as following: Mixing workers earn $10.50/hr, Filling and baking workers earn $10.50/hr, Packaging workers earn $15.50/hr. The sum of all expected hourly employee gross monthly pay amounts are added to the salaried production workers gross monthly pay and the projected total payroll added costs (Employer taxes, Social Security, etc.) to get "total labor dollars cost for the month. The total labor dollars are divided by projected sales revenues to get a projected labor percentage. Management watches this number pretty closely and tries to keep it around 20% of sales. In the past, it was assumed that labor costs for the company did not change with sales volume, and some months were profitable and some were not. Currently, Humble Pies' managers adjust labor hours up or down depending on the demand for pies and try to keep the projected labor near 20% of sales. Costing Issues Linda and Taylor are skilled at determining the cost of ingredients, but when it comes to labor and the overhead of each product line, they're not sure where to start. At the moment, Humble Pies allocates the same amount of overhead costs to every output unit. While total labor averages 20%, they believe that labor and overhead costs vary greatly by product line. And, since the company does not currently track labor hours by product line, Linda and Taylor have no idea of labor cost or profitability by product line. A digital biometric time clock keeps track of hours for the employees, but management is open to asking shift workers to track their hours by job or batch. Taylor and Linda's primary concern is making sure there is a good reason to change the method and that there's a simple and low-cost way to track it. The company has a small but growing administrative staff that can do some basic record keeping while the Controller manages financial reporting, taxes and decision analysis, a skill she developed while working toward her CGMA designation. The Controller has asked for help determining a product costing system Humble Pies can use for pricing decisions, product line profitability analysis, financial planning and helping managers understand the business. But costs are only one component. The company currently bases pricing decisions on the three C's: cost, consumer and competition. As a bare minimum, the company wants to achieve a target 17% gross profit margin (or higher) on cost, but Linda and Taylor consider what a consumer is willing to pay the most important factor in pricing. They want to be sure to keep Humble Pies competitive with other companies. Table 1 provides selected actual cost and revenue data for May 2018. Additional information about costs can be found in the Notes to Selected Financial Data below. Table 1: Selected Financial Data (actual cost and revenue data for May 2018) May 2018 $766,667 327,934 158,767 41,367 3,833 4,907 64,707 9,813 3,067 920 4,293 2,300 25,300 Cost Category Behavior Sales Expenses: Raw Materials 1 Variable Bakery labor 2 Mixed Administration Salaries Fixed Supplies Variable Freight & Shipping-In Variable Freight & Shipping-Out Variable Utilities - Electricity Variable Utilities - Gas (ovens) Variable Water Variable Repairs & Maintenance Fixed Telephone & Internet Fixed Co-owners' salary Fixed Depreciation Expense: Plant Building $9,460 Pastry Machines 6,920 Mixers 7,832 Filling Equip. 7,471 Ovens 8,941 Warehouse Freezers 9.210 Fixed Total Expenses Operating Profit Income Tax Net operating income Unit volume (30,980 whole, 33,520 variety) Average Operating Assets Minimum Rate of Return Total Depr. 49,834 697,042 69,625 22,280 $47,345 64,500 units $5,500,000 8.00% Notes to Selected Financial Data Raw Materials: Includes main ingredients and flavor additives. Main ingredients are relatively higher cost items such as flour, sugar, eggs, nuts and fruit that appear on the package label. Flavor additives are relatively low-dollar cost items and a small part of the weight of the pie such as spices, dyes, salt, and certain oils that don't always appear on the package label. Besides the crust and filling ingredients, raw materials include the tins, packaging and labels. Bakery labor: The cost amount consists of 22% supervisory salaries and taxes and the rest hourly workers. Bakery labor workers are organized into four categories: production line (mixing, filling and baking), packaging, sanitation and warehouse (all included as part of cost of goods sold). Administration Salaries: Includes taxes and benefits for the Vice President of Operations, the Controller, Human Resources Manager and two administrative support people. Supplies: Includes supplies relating to production, decorating, sanitation and warehouse (think: adhesive, pastry bags, spatulas, scrapers, icing pens, gloves and so on). Freight & Shipping-In: The costs of shipping raw ingredients and other materials to the factory from suppliers. Freight & Shipping-Out: The costs of shipping finished products to customer locations and distribution centers. Utilities Electricity: Approximately 10% for administrative office and the remainder for the factory. The factory portion varies somewhat with production volume. Utilities Gas (ovens): The factory portion varies with production volume. Water: All for sanitation and varies proportionately with production volume. Repairs & Maintenance: All for production. Telephone & Internet: All for the administrative office. Co-owners' salary: Linda Jackson and Taylor Johnson Brokers' commissions: Generally 4% of sales. Income Tax: Average total tax rate is 32%. Classification Allocate by: Product Product Track by: Product standard cost Batch Direct cost per unit Expenses Raw Materials Bakery Labor Administration Salaries Supplies Freight & Shipping-In Period Product Product Batch Direct cost per unit Assign to raw material cost based on materials cost Individual Job Production volume Product Product (90%) | Period (10%) Product Product Product Period Production Volume Production volume Period Freight & Shipping-out Utilities Electricity Utilities Gas (Ovens) Water Repairs & Maintenance Telephone & Internet (administrative) Co-owners' Salary Depreciation Expense: Plant Building Pastry Machines Mixers Filling Equipment Ovens Warehouse Freezers Brokers' commissions | Period (15%) Product (85%) Product Product Product Product Product Production volume Machine hours Machine hours Machine hours Production volume Production volume Period(4% of sales) A B D E F H 101 50 60 Whole Unit cost Variety Unit cost Units Total $ Units Total $ 1 Job # 2 Amounts ordered: 3 Whole pies 4 Variety pack 5 5 6 7 Direct Material 8 9 9 10 11 Direct Labor 12 13 14 15 Manufuring Overhead* 16 17 18 Hours Cost/hr Total $ Hours Cost/hr Total $ Cost driver Cost/unit of driver Total $ Cost driver Cost/unit of driver Total $ 19 20 21 Total cost for job per product 22 23 Cost per unit 24 25 Selling price per unit 26 27 28 *Overhead Calculation -- description of method: 29 Total overhead cost overhead cost cost driver 30 31 32 33 34 35 36 37 cost driver rate description 1 Raw mate>rials: Crust ingredients ($.11) $7,120 Filling ingredients($4.65) 300,165 Packaging: Tins ($.08) 5,065 Labels ($.076) 4,916 Boxes ($.11) 3,617 Plastic containers ($.22) 7,051 $327,934 2 Labor: Production Supervisors' Salaries $34,929 Production line wages ($10.50/hr) 51,613 Packaging labor ($15.50/hr): whole pies 7,016 variety pack 31,359 Sanitation wages ( $15.50/hr) 18,940 Shipping & receiving wages ($15.50/hr) 14,910 $158,767 A couple years ago, as demand for the pies grew to a national market (thanks to the company's Instagram account), the co-owners hired a new Controller, a CPA with her Chartered Global Management Accountant (CGMA) designation from their CPA firm to help them continue to grow and stay profitable. Now they just landed their largest grocery store yet. In 2017, the company had $6.1 million in sales revenue and is on track to do $9.3 million this year. Humble Pies uses natural and organic ingredients, and combines Linda's Parisian techniques with Taylor's unexpected takes on classical southern desserts like Bacon Chocolate Chess, Avocado Key Lime and Chai Apple Pie. It offers two main product lines: 10-inch whole pies are pre-sliced, boxed and sold to distributors for food service applications or grocery in-store bakery cases. 10-inch variety pies are packed in strong, clear plastic domes to be sold in refrigerated cases and with custom labels. The variety packs contain two pieces of each kind of pie. Linda and Taylor love getting feedback from their fans and are always testing new recipes based on suggestions or grocer suppliers' needs. They often receive requests from food chains for different types and sizes of pies, and must decide which ones to accept and which ones to pass on. Pie production Naturally, Linda and Taylor can't reveal their recipes, but they have provided some details on how the pies are made. Most pies go through a general four-step process: mixing, filling, baking and packaging. Humble Pies makes five different crusts mixed in large batches, and fillings are produced in smaller batches depending on the production schedule. Next, crusts are placed in tins and filled with, well, the filling and baked for 45 minutes (20 at a time). After they've cooled for an hour, pies are decorated, sliced, packaged, and labeled and placed on pallets to freeze until shipped. It takes about a week to complete a pie product order and the plant uses just-in- time production methods. Since contaminated food would lead to a visit by the Health Department (and possibly shutting down the factory), there are at least three sanitation workers on duty at all times. Generally, there are 3-4 warehouse workers on duty to handle the shipping, receiving and storage of raw materials and finished product. The plant typically runs two shifts per day with two production supervisors assigned to each shift. For each of the two product lines, the process is combined in the same production line until the packaging area. The process is the same regardless of the flavors or ingredients for the production line (mixing taking about 3 minutes per pie, filling taking about 5 seconds per pie, and baking.) However, the processes between the product lines is very different in the packaging department, because the variety packs take much longer than for whole pies. Workers need to pull different flavor slices and place them in the same tin for the variety pack. Not to mention the packaging is different. The whole pies go in boxes while the variety pies go in lidded plastic containers. Both lines have similar labeling requirements. Humble Pies seldom places its own labels and logo on any of their products. Label designs generally come from the customer, so they vary based on each order. The plant currently has capacity to do $1 million in sales per month, but with additional investments in ovens, mixers and workstations (for about $500,000) it could increase to $1.5 million. October through December tends to be a higher volume period (with increased demand for holidays like Thanksgiving and New Year's), resulting in Humble Pies getting roughly 60% of its business during that time period. Because of the rush, the plant runs overtime and weekend shifts as needed to get the product to its suppliers. The owners believe the labeling process significantly slows down production time. Reports Humble Pies' managers rely heavily on a "Labor Report" to manage its work force. The report lists four salaried workers and approximately 50 hourly employees, expected number of work days for the month, hours per day (typically 8) and total projected hours for the month. The hours are multiplied by the employee pay rate (from $10.50-$15.50 per hour) to get expected monthly gross pay amount for each hourly employee based on a 40-hour workweek. Production workers are paid as following: Mixing workers earn $10.50/hr, Filling and baking workers earn $10.50/hr, Packaging workers earn $15.50/hr. The sum of all expected hourly employee gross monthly pay amounts are added to the salaried production workers gross monthly pay and the projected total payroll added costs (Employer taxes, Social Security, etc.) to get "total labor dollars cost for the month. The total labor dollars are divided by projected sales revenues to get a projected labor percentage. Management watches this number pretty closely and tries to keep it around 20% of sales. In the past, it was assumed that labor costs for the company did not change with sales volume, and some months were profitable and some were not. Currently, Humble Pies' managers adjust labor hours up or down depending on the demand for pies and try to keep the projected labor near 20% of sales. Costing Issues Linda and Taylor are skilled at determining the cost of ingredients, but when it comes to labor and the overhead of each product line, they're not sure where to start. At the moment, Humble Pies allocates the same amount of overhead costs to every output unit. While total labor averages 20%, they believe that labor and overhead costs vary greatly by product line. And, since the company does not currently track labor hours by product line, Linda and Taylor have no idea of labor cost or profitability by product line. A digital biometric time clock keeps track of hours for the employees, but management is open to asking shift workers to track their hours by job or batch. Taylor and Linda's primary concern is making sure there is a good reason to change the method and that there's a simple and low-cost way to track it. The company has a small but growing administrative staff that can do some basic record keeping while the Controller manages financial reporting, taxes and decision analysis, a skill she developed while working toward her CGMA designation. The Controller has asked for help determining a product costing system Humble Pies can use for pricing decisions, product line profitability analysis, financial planning and helping managers understand the business. But costs are only one component. The company currently bases pricing decisions on the three C's: cost, consumer and competition. As a bare minimum, the company wants to achieve a target 17% gross profit margin (or higher) on cost, but Linda and Taylor consider what a consumer is willing to pay the most important factor in pricing. They want to be sure to keep Humble Pies competitive with other companies. Table 1 provides selected actual cost and revenue data for May 2018. Additional information about costs can be found in the Notes to Selected Financial Data below. Table 1: Selected Financial Data (actual cost and revenue data for May 2018) May 2018 $766,667 327,934 158,767 41,367 3,833 4,907 64,707 9,813 3,067 920 4,293 2,300 25,300 Cost Category Behavior Sales Expenses: Raw Materials 1 Variable Bakery labor 2 Mixed Administration Salaries Fixed Supplies Variable Freight & Shipping-In Variable Freight & Shipping-Out Variable Utilities - Electricity Variable Utilities - Gas (ovens) Variable Water Variable Repairs & Maintenance Fixed Telephone & Internet Fixed Co-owners' salary Fixed Depreciation Expense: Plant Building $9,460 Pastry Machines 6,920 Mixers 7,832 Filling Equip. 7,471 Ovens 8,941 Warehouse Freezers 9.210 Fixed Total Expenses Operating Profit Income Tax Net operating income Unit volume (30,980 whole, 33,520 variety) Average Operating Assets Minimum Rate of Return Total Depr. 49,834 697,042 69,625 22,280 $47,345 64,500 units $5,500,000 8.00% Notes to Selected Financial Data Raw Materials: Includes main ingredients and flavor additives. Main ingredients are relatively higher cost items such as flour, sugar, eggs, nuts and fruit that appear on the package label. Flavor additives are relatively low-dollar cost items and a small part of the weight of the pie such as spices, dyes, salt, and certain oils that don't always appear on the package label. Besides the crust and filling ingredients, raw materials include the tins, packaging and labels. Bakery labor: The cost amount consists of 22% supervisory salaries and taxes and the rest hourly workers. Bakery labor workers are organized into four categories: production line (mixing, filling and baking), packaging, sanitation and warehouse (all included as part of cost of goods sold). Administration Salaries: Includes taxes and benefits for the Vice President of Operations, the Controller, Human Resources Manager and two administrative support people. Supplies: Includes supplies relating to production, decorating, sanitation and warehouse (think: adhesive, pastry bags, spatulas, scrapers, icing pens, gloves and so on). Freight & Shipping-In: The costs of shipping raw ingredients and other materials to the factory from suppliers. Freight & Shipping-Out: The costs of shipping finished products to customer locations and distribution centers. Utilities Electricity: Approximately 10% for administrative office and the remainder for the factory. The factory portion varies somewhat with production volume. Utilities Gas (ovens): The factory portion varies with production volume. Water: All for sanitation and varies proportionately with production volume. Repairs & Maintenance: All for production. Telephone & Internet: All for the administrative office. Co-owners' salary: Linda Jackson and Taylor Johnson Brokers' commissions: Generally 4% of sales. Income Tax: Average total tax rate is 32%