

Answered step by step
Verified Expert Solution
Question
1 Approved Answer
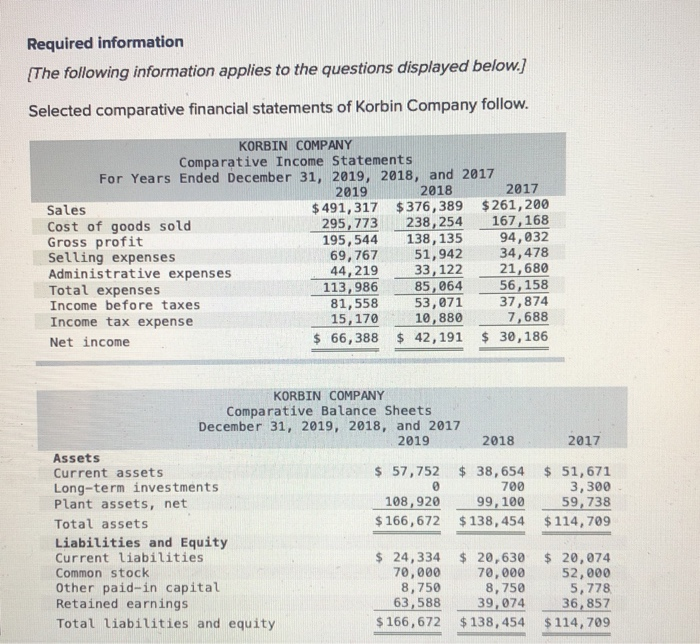
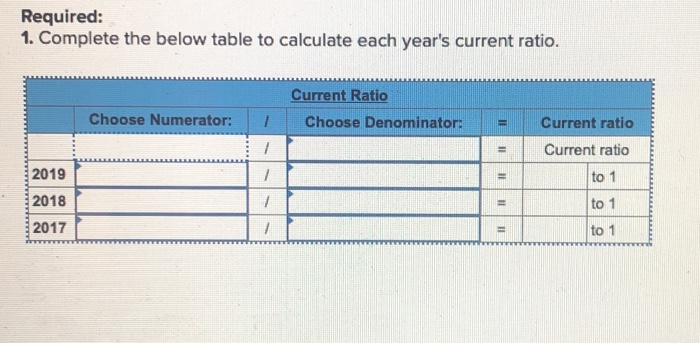
1. Complete the below table to calculate each years current ratio. Options for Choose Numerator: Accounts receivable, Cost of goods sold, Current assets, Current liabilities,
1. Complete the below table to calculate each years current ratio.
Options for Choose Numerator: Accounts receivable, Cost of goods sold, Current assets, Current liabilities, Net Sales
Options for Choose Denominator: Current Assets, Current liabilities, Net sales, Accounts receivable net, Cost of goods sold, Average accounts receivable net
(Rest of boxes do not have answer options)
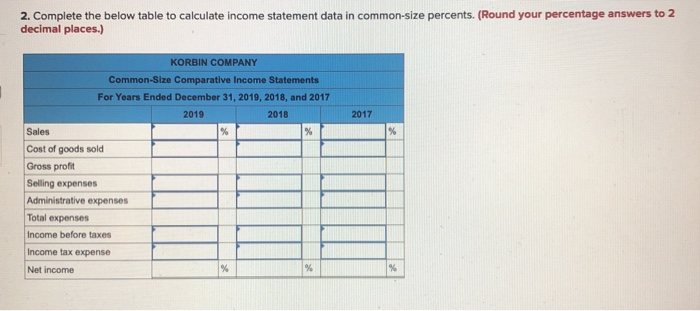
2. Complete the table to calculate income statement data in common-size percents
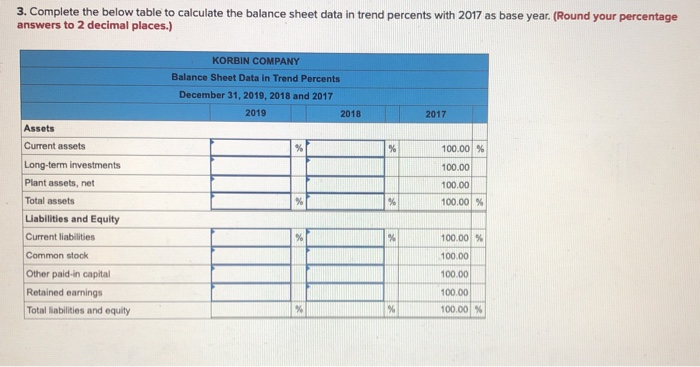
3. Complete the below table to calculate the balance sheet data in trend percents with 2017 as base year
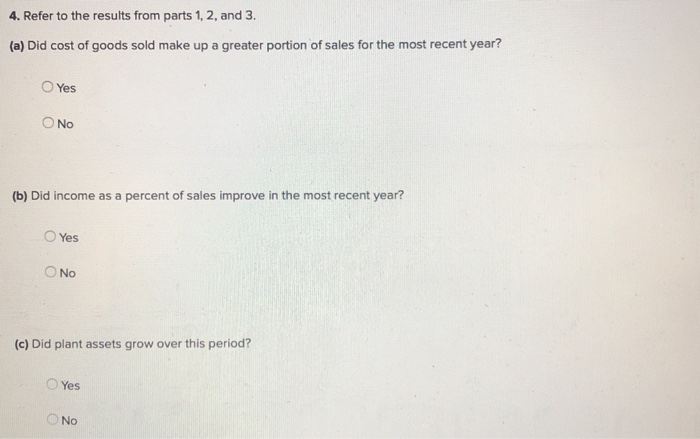
4. Refer to the results from parts 1, 2, and 3
a. Did the cost of goods sold make up a greater portion of sales for the most recent year? Y/N
b. Did income as a percent of sales improve in the most recent year? Y/N
c. Did plant assets grow over this period? Y/N
Step by Step Solution
There are 3 Steps involved in it
Step: 1

Get Instant Access to Expert-Tailored Solutions
See step-by-step solutions with expert insights and AI powered tools for academic success
Step: 2

Step: 3
Ace Your Homework with AI
Get the answers you need in no time with our AI-driven, step-by-step assistance
Get Started
Towards A Strategic Human Resource Management Roles Of HR Audit And Org Culture
Authors: Adel Al Samman
1st Edition
3330653051, 978-3330653054