Answered step by step
Verified Expert Solution
Question
1 Approved Answer
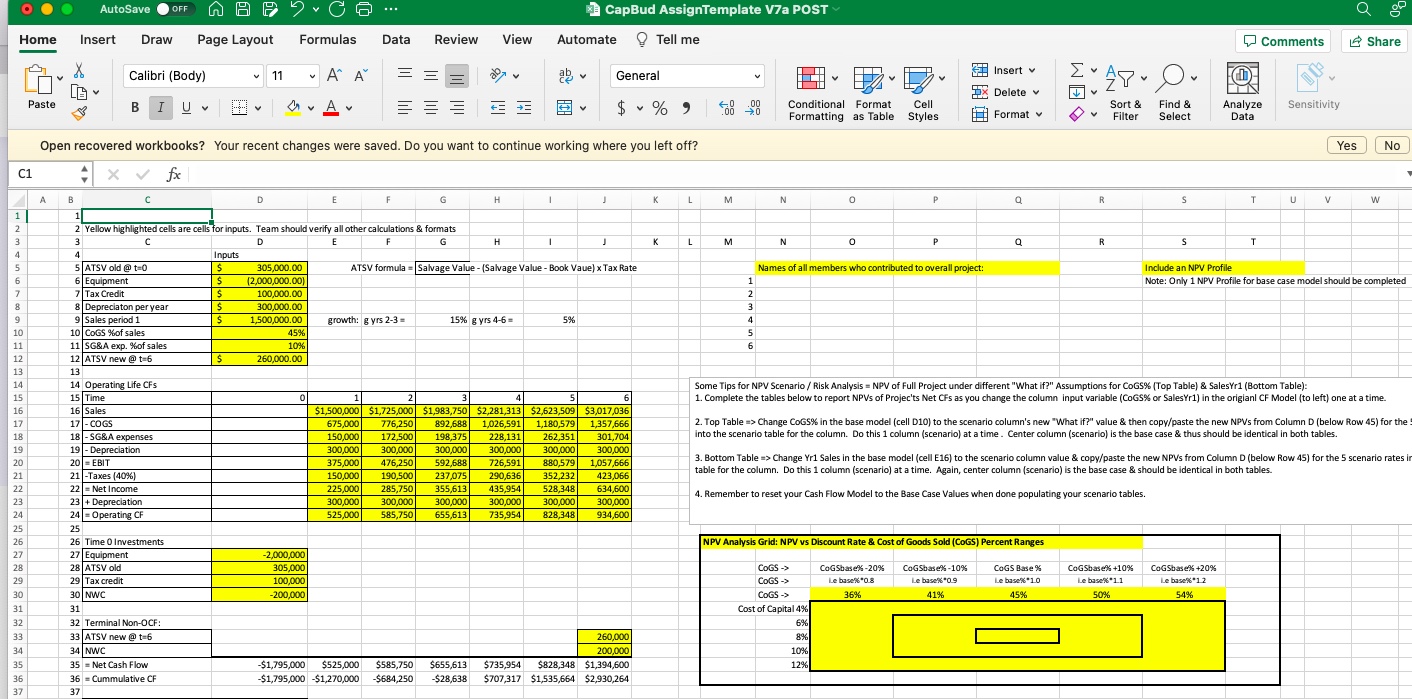
1. Complete the tables below to report NPVs of Projects Net CFs as you change the column input variable (CoGS% or SalesYr1) in the


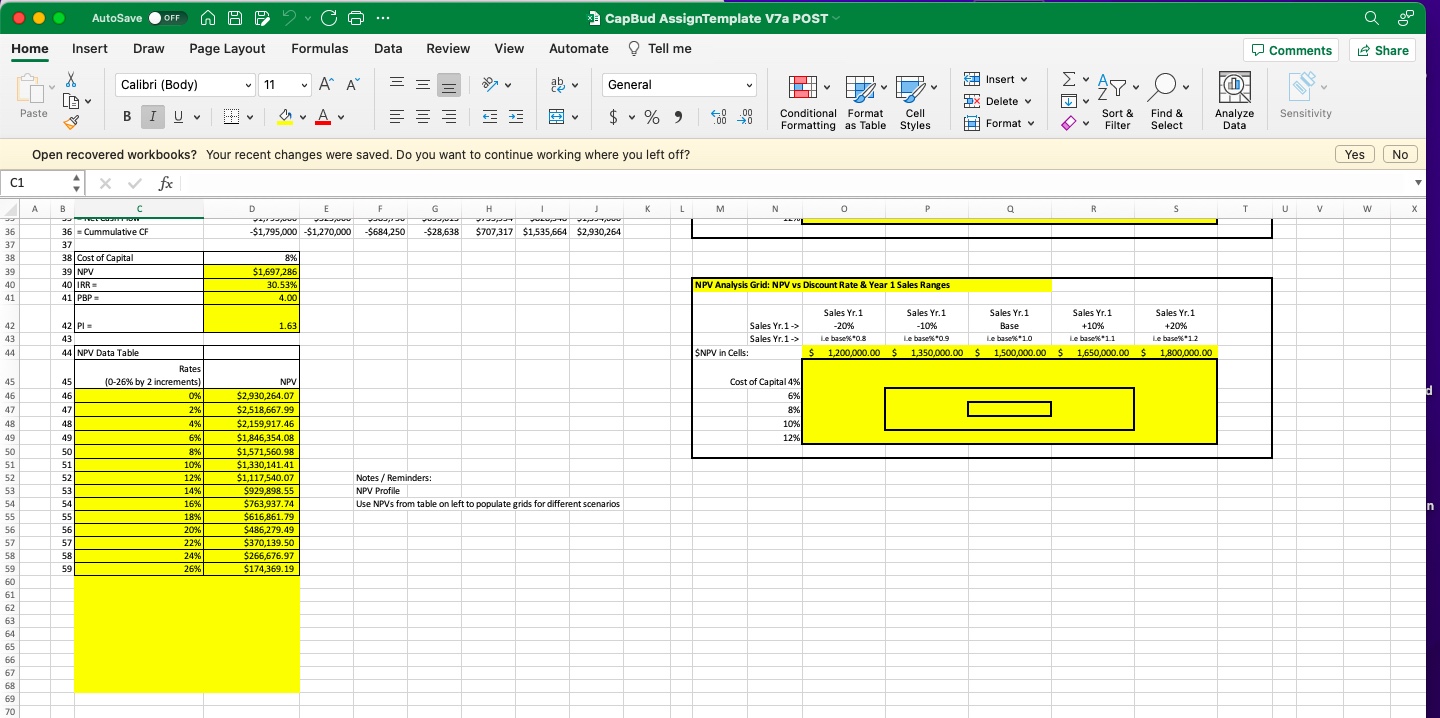
1. Complete the tables below to report NPVs of Projects Net CFs as you change the column input variable (CoGS% or SalesYr1) in the origianl CF Model (to left) one at a time. 2. Top Table => Change CoGS% in the base model (cell D10) to the scenario column's new "What if?" value & then copy/paste the new NPVs from Column D (below Row 45) for the! into the scenario table for the column. Do this 1 column (scenario) at a time. Center column (scenario) is the base case & thus should be identical in both tables. 3. Bottom Table => Change Yr1 Sales in the base model (cell E16) to the scenario column value & copy/paste the new NPVs from Column D (below Row 45) for the 5 scenario rates ir table for the column. Do this 1 column (scenario) at a time. Again, center column (scenario) is the base case & should be identical in both tables. 4. Remember to reset your Cash Flow Model to the Base Case Values when done populating your scenario tables. Home AutoSave OFF Insert Draw Page Layout Formulas Data CapBud AssignTemplate V7a POST Tell me Review View Automate Comments Share Insert Delete Cell Format Sort & Filter Find & Select Analyze Sensitivity Data C1 Paste Calibri (Body) BIU 11 ' ' A General $ %" Open recovered workbooks? Your recent changes were saved. Do you want to continue working where you left off? Conditional Format Formatting as Table Styles Yes No 19 20 18-SG&A expenses 19 - Depreciation 20-EBIT 21 21-Taxes (40%) 22 22 Net Income 23 23+ Depreciation 24 24-Operating CF x fx A B D E H J K M N 1 1 2 Yellow highlighted cells are cells for inputs. Team should verify all other calculations & formats 3 3 D E F G H 1 J K L M N 4 4 Inputs 5 5 ATSV old @t=0 $ 305,000.00 ATSV formula = Salvage Value - (Salvage Value - Book Vaue) x Tax Rate 6 6 Equipment $ (2,000,000.00) 7 7 Tax Credit $ 100,000.00 8 8 Depreciaton per year $ 300,000.00 1 2 3 9 9 Sales period 1 $ 1,500,000.00 growth: g yrs 2-3= 15% g yrs 4-6- 5% 10 10 COGS %of sales 45% 11 11 SG&A exp. % of sales 10% 5 6 12 12 ATSV new @ t=6 $ 260,000.00 13 13 14 14 Operating Life CFs 15 15 Time 16 16 Sales 17 17 - COGS 1 2 4 6 $1,500,000 $1,725,000 $1,983,750 $2,281,313 $2,623,509 $3,017,036 675,000 776,250 892,688 1,026,591 1,180,579 1,357,666 150,000 172,500 198,375 262,351 301,704 300,000 300,000 300,000 300,000 300,000 300,000 375,000 476,250 592,688 726,591 880,579 1,057,666 150,000 190,500 237,075 290,636 352,232 423,066 225,000 285,750 355,613 435,954 528,348 634,600 300,000 300,000 300,000 300,000 300,000 300,000 525,000 585,750 655,613 735,954 828,348 934,600 228,131 P R S T U V W P Q R T Names of all members who contributed to overall project: Include an NPV Profile Note: Only 1 NPV Profile for base case model should be completed Some Tips for NPV Scenario/Risk Analysis = NPV of Full Project under different "What if?" Assumptions for CoGS% (Top Table) & SalesYr1 (Bottom Table): 1. Complete the tables below to report NPVs of Projec'ts Net CFs as you change the column input variable (COGS% or Sales Yr1) in the origianl CF Model (to left) one at a time. 2. Top Table => Change CoGS% in the base model (cell D10) to the scenario column's new "What if?" value & then copy/paste the new NPVs from Column D (below Row 45) for the into the scenario table for the column. Do this 1 column (scenario) at a time. Center column (scenario) is the base case & thus should be identical in both tables. 3. Bottom Table => Change Yr1 Sales in the base model (cell E16) to the scenario column value & copy/paste the new NPVs from Column D (below Row 45) for the 5 scenario rates in table for the column. Do this 1 column (scenario) at a time. Again, center column (scenario) is the base case & should be identical in both tables. 4. Remember to reset your Cash Flow Model to the Base Case Values when done populating your scenario tables. 25 25 26 26 Time 0 Investments NPV Analysis Grid: NPV vs Discount Rate & Cost of Goods Sold (COGS) Percent Ranges 27 27 Equipment -2,000,000 28 28 ATSV old 305,000 29 29 Tax credit 100,000 COGS -> COGS -> CoGSbase%-20% Le base%*0.8 CoGSbase%-10% COGS Base% 30 30 NWC -200,000 COGS -> 36% Le base %*0.9 41% Le base %*1.0 45% CoGSbase% +10% Le base %*1.1 50% CoGSbase % +20% Le base %*1.2 54% 31 Cost of Capital 4% 32 32 Terminal Non-OCF: 6% 33 33 ATSV new @t=6 34 34 NWC 260,000 200,000 8% 10% 35 35 Net Cash Flow 36 36 = Cummulative CF -$1,795,000 $525,000 $585,750 -$1,795,000-$1,270,000 -$684,250 -$28,638 $655,613 $735,954 $828,348 $1,394,600 $707,317 $1,535,664 $2,930,264 12% 37 37 AutoSave OFF Home Insert Draw Page Layout Paste Calibri (Body) BIU Formulas Data Review View Automate 11 ' ' CapBud AssignTemplate V7a POST Tell me Comments Share Insert v General O $ % 900 +0 Conditional Format Formatting as Table Styles Cell Delete v Format Sort & Filter Find & Select Analyze Data Sensitivity C1 Open recovered workbooks? Your recent changes were saved. Do you want to continue working where you left off? xfx A B D G K L 36 = Cummulative CF -$1,795,000 - $1,270,000 -$684,250 -$28,638 $707,317 $1,535,664 $2,930,264 37 37 38 38 Cost of Capital 39 39 NPV 40 IRR= 41 41 PBP = 8% $1,697,286 30.53% 4.00 42 43 44 44 NPV Data Table Rates 1.63 45 (0-26% by 2 increments) NPV 0% $2,930,264.07 47 47 2% $2,518,667.99 48 48 4% $2,159,917.46 49 49 6% $1,846,354.08 50 8% $1,571,560.98 10% $1,330,141.41 52 52 12% $1,117,540.07 53 53 14% $929,898.55 Notes/Reminders: NPV Profile 16% $763,937.74 Use NPVs from table on left to populate grids for different scenarios 55 55 18% $616,861.79 56 56 20% $486,279.49 57 22% $370,139.50 58 58 24% $266,676.97 59 26% $174,369.19 60 61 62 63 64 65 66 67 68 69 70 NPV Analysis Grid: NPV vs Discount Rate & Year 1 Sales Ranges Sales Yr.1-> Sales Yr.1-> SNPV in Cells: Cost of Capital 4% 6% 8% 10% 12% Sales Yr.1 -20% Le base%*0.8 $ 1,200,000.00 $ Sales Yr.1 -10% Sales Yr.1 Base Sales Yr.1 +10% Le base %*0.9 Le base %*1.0 Le base %*1.1 1,350,000.00 $ 1,500,000.00 $ 1,650,000.00 $ Sales Yr.1 +20% Le base %*1.2 1,800,000.00 Yes No U V W X d
Step by Step Solution
There are 3 Steps involved in it
Step: 1

Get Instant Access to Expert-Tailored Solutions
See step-by-step solutions with expert insights and AI powered tools for academic success
Step: 2

Step: 3

Ace Your Homework with AI
Get the answers you need in no time with our AI-driven, step-by-step assistance
Get Started


