Question
1. Compute the arithmetic and geometric mean return for large company stocks and the corresponding standard deviation. 2. Determine the coefficient of variation for large


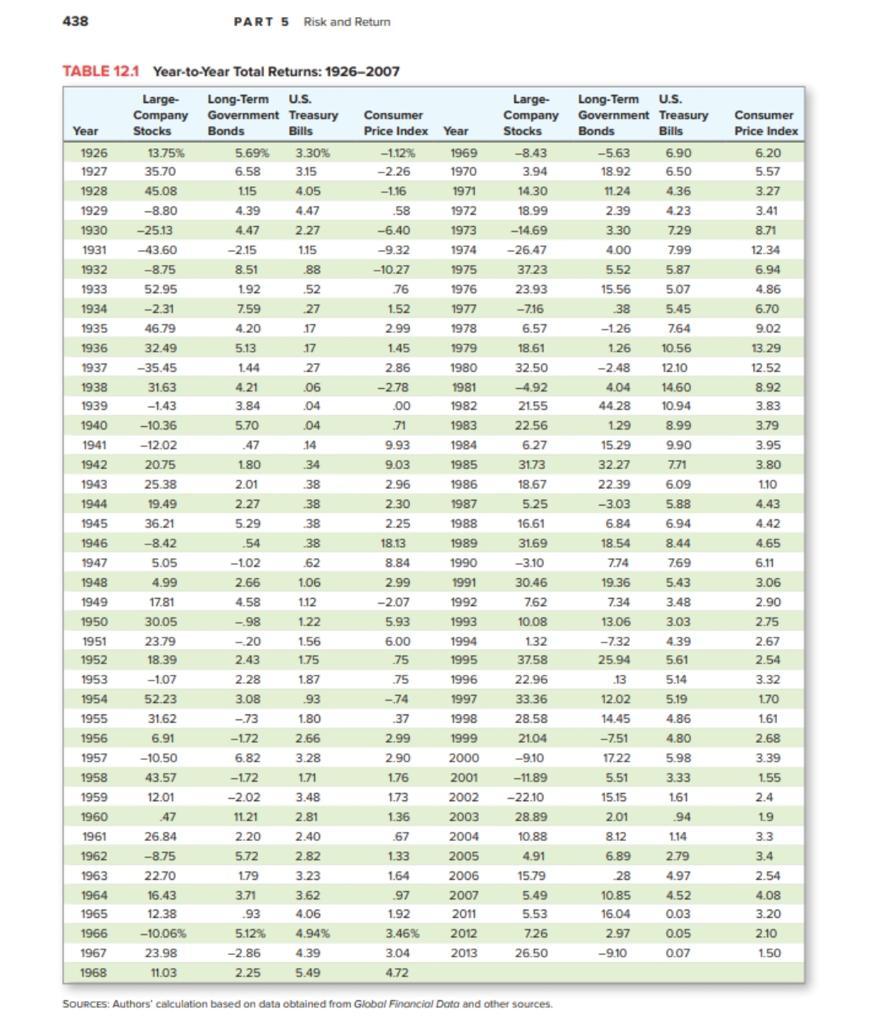
1. Compute the arithmetic and geometric mean return for large company stocks and the corresponding standard deviation.
2. Determine the coefficient of variation for large company stocks and interpret your results.
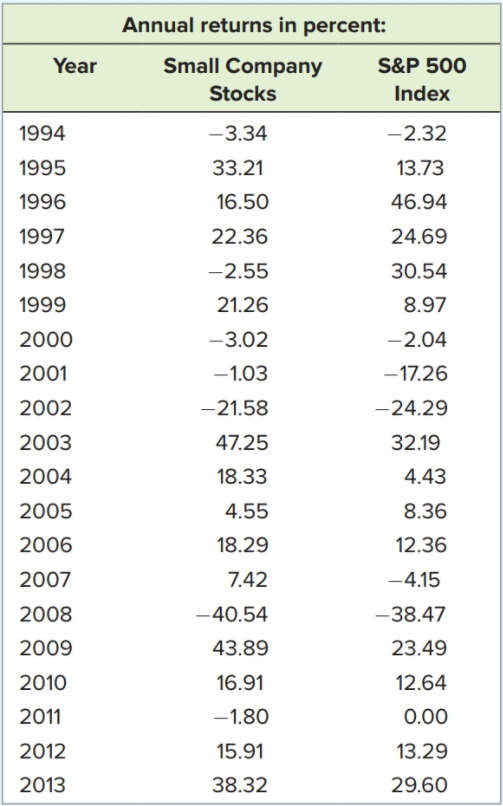
3. Use the return data provided in the box and repeat steps 1 and 2 above for the small company stocks and the S&P 500 index and compare the risk/return relationships based on the coefficient of variation (CV).
4. Calculate the beta of both large and small company stocks relative to the S&P 500 index and interpret your result.
5. Form an equally weighted portfolio of large and small stocks and compute the Reward-to-Risk Ratio (the slope of the Security Market Line).
6. Lower the weight of the equally weighted stock portfolio to 80 percent and add 20 percent US Treasury bills. Compute the resulting Reward-to-Risk Ratio. Increase the weight of US Treasury bills to 40 percent and 60 percent, repeat your computation, and interpret your results.
I need only Question from 4 to 6.
Annual returns in percent: Year Small Company Stocks S&P 500 Index 1994 -3.34 -2.32 1995 33.21 16.50 13.73 46.94 1996 1997 22.36 24.69 1998 -2.55 30.54 8.97 1999 21.26 2000 -3.02 -1.03 2001 -21.58 -2.04 -17.26 -24.29 32.19 4.43 2002 2003 2004 2005 47.25 18.33 4.55 8.36 2006 18.29 12.36 2007 7.42 -4.15 2008 -40.54 43.89 16.91 -38.47 23.49 2009 12.64 2010 2011 -1.80 0.00 2012 15.91 13.29 29.60 2013 38.32 438 PART 5 Risk and Return 1926 Consumer Price Index 6.20 5.57 3.27 3.41 8.71 12.34 6.94 4.86 2.99 1978 1980 TABLE 12.1 Year-to-Year Total Returns: 1926-2007 Large- Long-Term U.S. Company Government Treasury Consumer Year Stocks Bonds Bills Price Index Year 13.75% 5.69% 3.30% -1.12% 1969 1927 35.70 6.58 3.15 -2.26 1970 1928 45.08 1.15 4.05 - 1.16 1971 1929 -8.80 4.39 4.47 .58 1972 1930 -25.13 4.47 2.27 -6.40 1973 1931 -43.60 -2.15 1.15 -9.32 1974 1932 -8.75 8.51 .88 -10.27 1975 1933 52.95 1.92 .52 76 1976 1934 -2.31 7.59 27 152 1977 1935 46.79 4.20 17 1936 32.49 5.13 .17 1.45 1979 1937 -35.45 1.44 27 2.86 1938 31.63 4.21 .06 -2.78 1981 1939 -1.43 3.84 .04 .00 1982 1940 -10.36 5.70 04 71 1983 1941 -12.02 .47 14 9.93 1984 1942 20.75 1.80 34 9.03 1985 1943 25.38 2.01 38 2.96 1986 1944 19.49 2.27 38 2.30 1987 1945 36.21 5.29 38 2.25 1988 1946 -8.42 .54 38 18.13 1989 1947 5.05 -1.02 62 8.84 1990 1948 4.99 2.66 1.06 2.99 1991 1949 17.81 4.58 112 -2.07 1992 1950 30.05 -98 1.22 5.93 1993 1951 23.79 - 20 1.56 6.00 1994 1952 18.39 2.43 1.75 .75 1995 1953 -1.07 2.28 1.87 .75 1996 1954 52.23 3.08 -74 - 1997 1955 31.62 -73 1.80 1998 1956 -172 2.66 2.99 1999 1957 -10.50 6.82 3.28 2.90 1958 43.57 -172 1.71 1.76 2001 1959 12.01 3.48 173 2002 1960 47 11.21 2.81 136 2003 1961 26.84 2.20 2.40 .67 2004 1962 -8.75 5.72 2.82 133 2005 1963 22.70 179 3.23 1.64 2006 1964 16.43 3.71 3.62 97 2007 1965 12.38 .93 4.06 1.92 2011 1966 -10.06% 5.12% 4.94% 3.46% 2012 1967 23.98 -2.86 4.39 3.04 2013 1968 11.03 2.25 5.49 4.72 Large- Long-Term U.S. Company Government Treasury Stocks Bonds Bills -8.43 -5.63 6.90 3.94 18.92 6.50 14.30 11.24 4.36 18.99 2.39 4.23 -14.69 3.30 7.29 -26.47 4.00 7.99 37.23 5.52 5.87 23.93 15.56 5.07 -7.16 38 5.45 6.57 -1.26 7.64 18.61 126 10.56 32.50 -2.48 12.10 -4.92 4.04 14.60 21.55 44.28 10.94 22.56 1.29 8.99 6.27 15.29 9.90 31.73 32.27 7.71 18.67 22.39 6.09 5.25 -3.03 5.88 16.61 6.84 6.94 31.69 18.54 8.44 -3.10 7.74 769 30.46 19.36 5.43 7.62 7.34 3.48 10.08 13.06 3.03 132 -7.32 4.39 37.58 25.94 5.61 22.96 13 5.14 33.36 5.19 28.58 14.45 4.86 21.04 -7.51 4.80 -9.10 17.22 5.98 - 11.89 5.51 3.33 -22.10 15.15 1.61 28.89 2.01 94 10.88 8.12 114 4.91 6.89 2.79 15.79 28 4.97 5.49 10.85 4.52 5.53 16.04 0.03 7.26 2.97 0.05 26.50 -9.10 0.07 6.70 9.02 13.29 12.52 8.92 3.83 3.79 3.95 3.80 110 4.43 4.42 4.65 6.11 3.06 2.90 2.75 2.67 2.54 3.32 170 161 93 12.02 37 6.91 2000 2.68 3.39 1.55 2.4 -2.02 19 3.3 3.4 2.54 4.08 3.20 2.10 1.50 SOURCES: Authors' calculation based on data obtained from Global Financial Data and other sources : ' . Annual returns in percent: Year Small Company Stocks S&P 500 Index 1994 -3.34 -2.32 1995 33.21 16.50 13.73 46.94 1996 1997 22.36 24.69 1998 -2.55 30.54 8.97 1999 21.26 2000 -3.02 -1.03 2001 -21.58 -2.04 -17.26 -24.29 32.19 4.43 2002 2003 2004 2005 47.25 18.33 4.55 8.36 2006 18.29 12.36 2007 7.42 -4.15 2008 -40.54 43.89 16.91 -38.47 23.49 2009 12.64 2010 2011 -1.80 0.00 2012 15.91 13.29 29.60 2013 38.32 438 PART 5 Risk and Return 1926 Consumer Price Index 6.20 5.57 3.27 3.41 8.71 12.34 6.94 4.86 2.99 1978 1980 TABLE 12.1 Year-to-Year Total Returns: 1926-2007 Large- Long-Term U.S. Company Government Treasury Consumer Year Stocks Bonds Bills Price Index Year 13.75% 5.69% 3.30% -1.12% 1969 1927 35.70 6.58 3.15 -2.26 1970 1928 45.08 1.15 4.05 - 1.16 1971 1929 -8.80 4.39 4.47 .58 1972 1930 -25.13 4.47 2.27 -6.40 1973 1931 -43.60 -2.15 1.15 -9.32 1974 1932 -8.75 8.51 .88 -10.27 1975 1933 52.95 1.92 .52 76 1976 1934 -2.31 7.59 27 152 1977 1935 46.79 4.20 17 1936 32.49 5.13 .17 1.45 1979 1937 -35.45 1.44 27 2.86 1938 31.63 4.21 .06 -2.78 1981 1939 -1.43 3.84 .04 .00 1982 1940 -10.36 5.70 04 71 1983 1941 -12.02 .47 14 9.93 1984 1942 20.75 1.80 34 9.03 1985 1943 25.38 2.01 38 2.96 1986 1944 19.49 2.27 38 2.30 1987 1945 36.21 5.29 38 2.25 1988 1946 -8.42 .54 38 18.13 1989 1947 5.05 -1.02 62 8.84 1990 1948 4.99 2.66 1.06 2.99 1991 1949 17.81 4.58 112 -2.07 1992 1950 30.05 -98 1.22 5.93 1993 1951 23.79 - 20 1.56 6.00 1994 1952 18.39 2.43 1.75 .75 1995 1953 -1.07 2.28 1.87 .75 1996 1954 52.23 3.08 -74 - 1997 1955 31.62 -73 1.80 1998 1956 -172 2.66 2.99 1999 1957 -10.50 6.82 3.28 2.90 1958 43.57 -172 1.71 1.76 2001 1959 12.01 3.48 173 2002 1960 47 11.21 2.81 136 2003 1961 26.84 2.20 2.40 .67 2004 1962 -8.75 5.72 2.82 133 2005 1963 22.70 179 3.23 1.64 2006 1964 16.43 3.71 3.62 97 2007 1965 12.38 .93 4.06 1.92 2011 1966 -10.06% 5.12% 4.94% 3.46% 2012 1967 23.98 -2.86 4.39 3.04 2013 1968 11.03 2.25 5.49 4.72 Large- Long-Term U.S. Company Government Treasury Stocks Bonds Bills -8.43 -5.63 6.90 3.94 18.92 6.50 14.30 11.24 4.36 18.99 2.39 4.23 -14.69 3.30 7.29 -26.47 4.00 7.99 37.23 5.52 5.87 23.93 15.56 5.07 -7.16 38 5.45 6.57 -1.26 7.64 18.61 126 10.56 32.50 -2.48 12.10 -4.92 4.04 14.60 21.55 44.28 10.94 22.56 1.29 8.99 6.27 15.29 9.90 31.73 32.27 7.71 18.67 22.39 6.09 5.25 -3.03 5.88 16.61 6.84 6.94 31.69 18.54 8.44 -3.10 7.74 769 30.46 19.36 5.43 7.62 7.34 3.48 10.08 13.06 3.03 132 -7.32 4.39 37.58 25.94 5.61 22.96 13 5.14 33.36 5.19 28.58 14.45 4.86 21.04 -7.51 4.80 -9.10 17.22 5.98 - 11.89 5.51 3.33 -22.10 15.15 1.61 28.89 2.01 94 10.88 8.12 114 4.91 6.89 2.79 15.79 28 4.97 5.49 10.85 4.52 5.53 16.04 0.03 7.26 2.97 0.05 26.50 -9.10 0.07 6.70 9.02 13.29 12.52 8.92 3.83 3.79 3.95 3.80 110 4.43 4.42 4.65 6.11 3.06 2.90 2.75 2.67 2.54 3.32 170 161 93 12.02 37 6.91 2000 2.68 3.39 1.55 2.4 -2.02 19 3.3 3.4 2.54 4.08 3.20 2.10 1.50 SOURCES: Authors' calculation based on data obtained from Global Financial Data and other sourcesStep by Step Solution
There are 3 Steps involved in it
Step: 1

Get Instant Access to Expert-Tailored Solutions
See step-by-step solutions with expert insights and AI powered tools for academic success
Step: 2

Step: 3

Ace Your Homework with AI
Get the answers you need in no time with our AI-driven, step-by-step assistance
Get Started


