Question
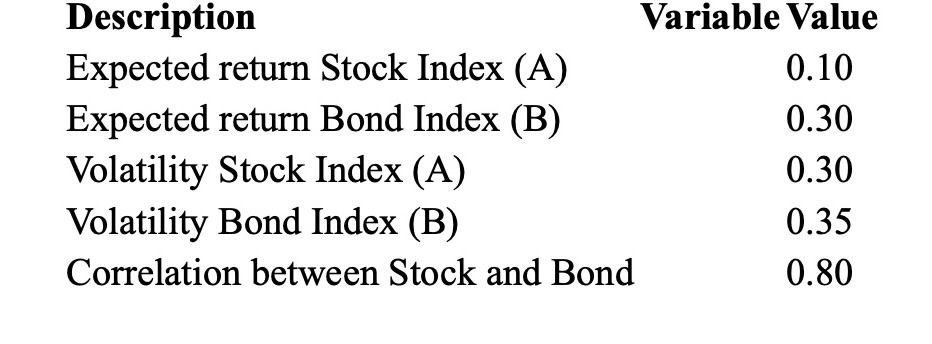
(1) Consider a portfolio of two risky assets with the following details: 1a) Compute the expected portfolio return and portfolio volatility of the minimum variance
(1) Consider a portfolio of two risky assets with the following details:

1a) Compute the expected portfolio return and portfolio volatility of the minimum variance portfolio.
1b) Draw a graph to illustrate the investment opportunity, use 3 allocations and clearly indicate where is the minimum variance portfolio (MVP) allocated.
(2) Consider a portfolio with two assets A and B such that A = 0.175, B = 0.055 and A = 0.067, B = 0.013
2a) Compute the expected portfolio return and portfolio volatility of the minimum variance portfolio. 2b) What is the 5% VaR of the minimum variance portfolio, assuming the financial returns are normally distributed? 2c) What is the 5% VaR for each individual asset, assuming the financial returns are normally distributed?
(3) Assume there are two assets, A and B, with A = 1.4 and B = 0.8. Assume also that the CAPM model applies. If the mean return on the market portfolio is 10% and the risk-free rate of return is 5%, calculate the mean return of the portfolios consisting of:
75% of asset A and 25% of asset B,
50% of asset A and 50% of asset B,
25% of asset A and 75% of asset B.
Description Variable Value ExpectedreturnStockIndex(A)ExpectedreturnBondIndex(B)VolatilityStockIndex(A)VolatilityBondIndex(B)CorrelationbetweenStockandBond0.100.300.300.350.80 Description Variable Value ExpectedreturnStockIndex(A)ExpectedreturnBondIndex(B)VolatilityStockIndex(A)VolatilityBondIndex(B)CorrelationbetweenStockandBond0.100.300.300.350.80Step by Step Solution
There are 3 Steps involved in it
Step: 1

Get Instant Access to Expert-Tailored Solutions
See step-by-step solutions with expert insights and AI powered tools for academic success
Step: 2

Step: 3

Ace Your Homework with AI
Get the answers you need in no time with our AI-driven, step-by-step assistance
Get Started


