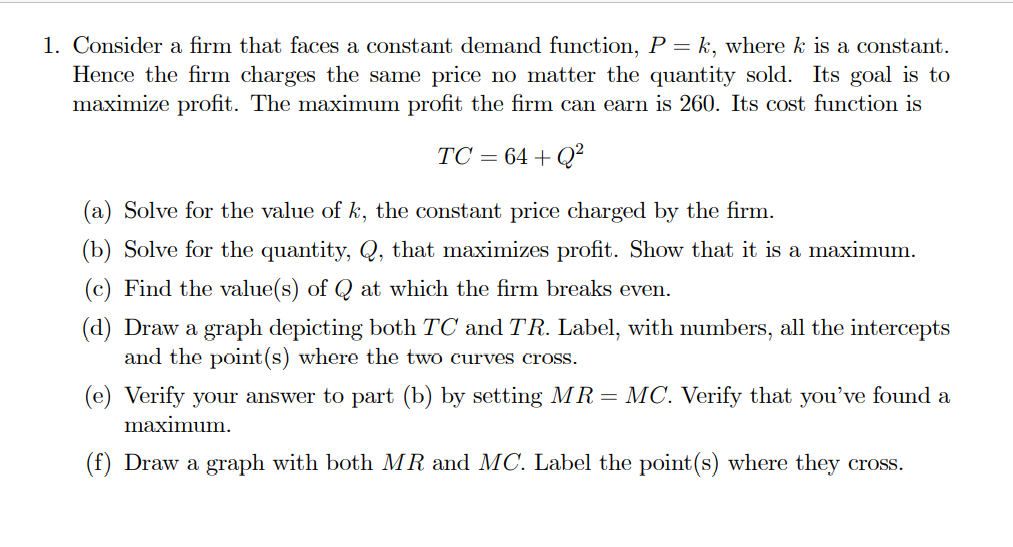
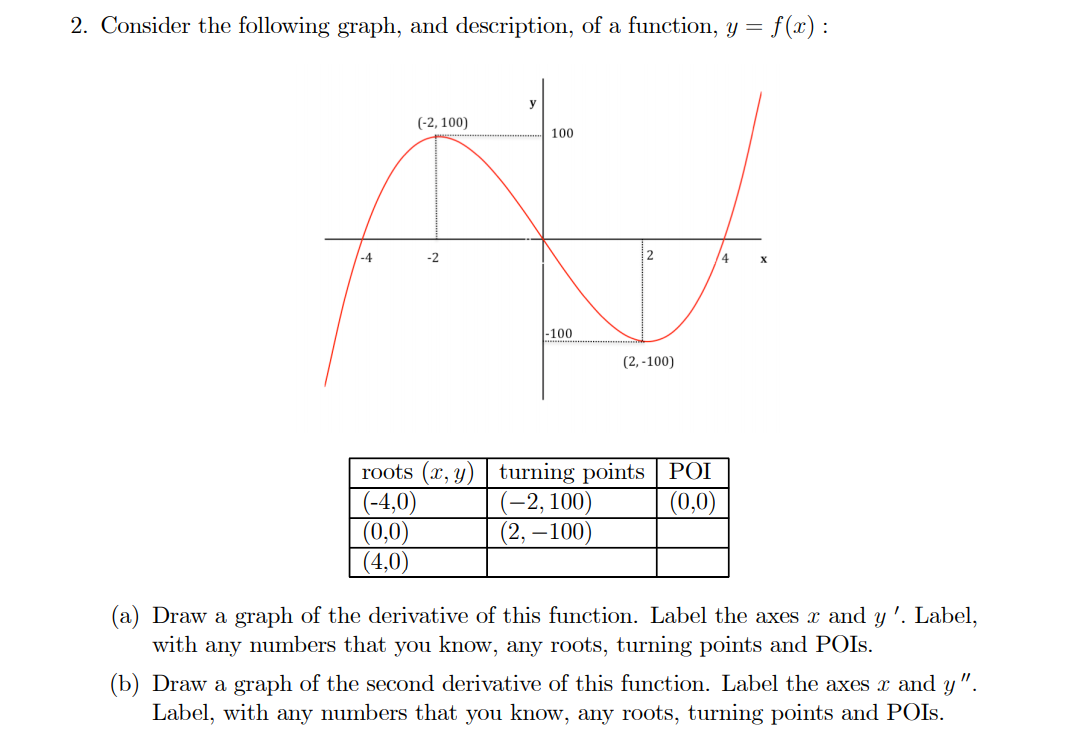
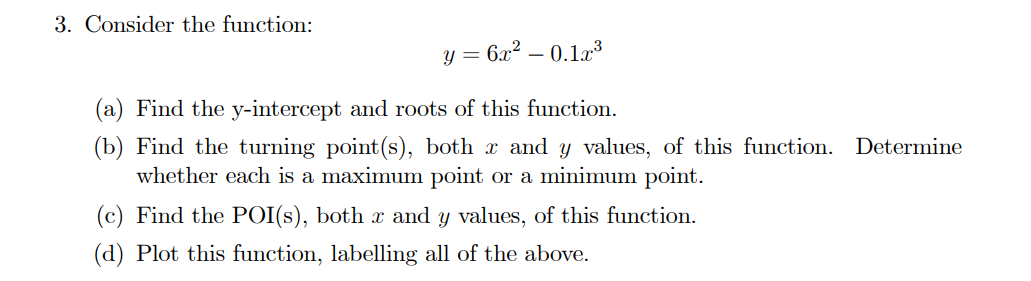
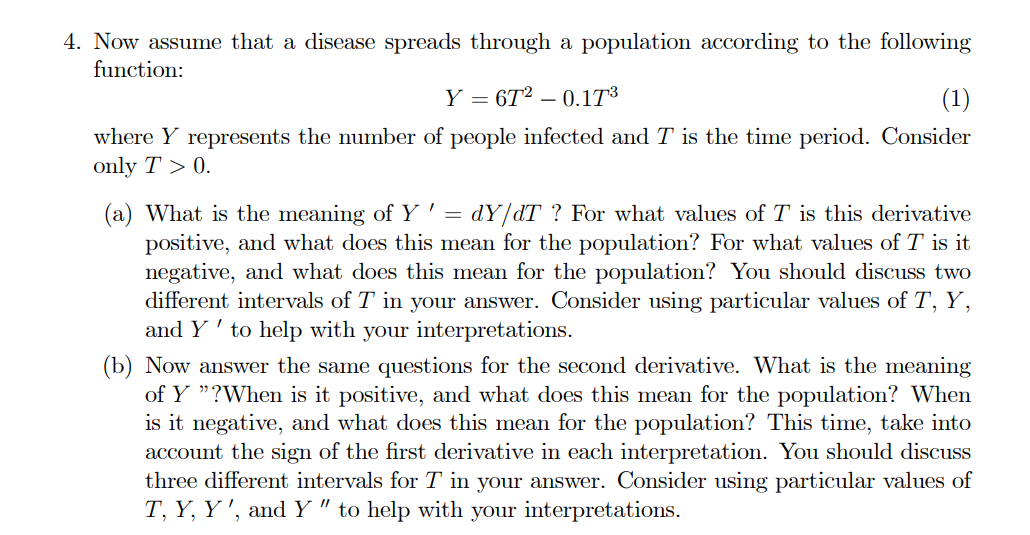
1. Consider a rm that faces a constant demand function, P : It, where k is a constant. Hence the rm charges the same price no matter the quantity sold. Its goal is to maximize prot. The maximum prot the rm can earn is 260. Its cost function is TC=64+Q2 (a) Solve for the value of k, the constant price charged by the rm. (b) Solve for the quantity, Q, that maximizes prot. Show that it is a maximum. (c) Find the value(s) of Q at which the rm breaks even. ) (d Draw a graph depicting both TC and TR. Label. with numbers2 all the intercepts and the point(s) where the two curves cross. (e) Verify your answer to part (b) by setting M R : MC. Verify that you've found a maximum. (f) Draw a graph with both MR and M C . Label the point(s) where they cross. 2. Consider the following graph, and description, of a function, y : f (1:) : (-2. mo] [2. 400) roots (m) (-450) (-2a 100) (0:0) (0,0) - - (a) Draw a graph of the derivative of this function. Label the axes it: and y '. Label, with any numbers that you know, any roots, turning points and POIs. (b) Draw a graph of the second derivative of this function. Label the axes a: and y \". Label, with any numbers that you know, any roots, turning points and POIs. 3. Consider the function: y = 6:52 0.13:3 (3,) Find the yintercept and roots of this function. (b) Find the turning point(s), both :1: and y values, of this function. Determine whether each is a maximum point or a minimum point. (c) Find the POI(s), both :1: and y values, of this function. (d) Plot this function, labelling all of the above. 4. Now assume that a disease Spreads through a population according to the following function: Y : 6T2 0.1T3 (1) where Y mpresents the number of peOple infected and T is the time period. Consider only T > 0. (a) What is the meaning of Y ' : dY/dT ? For what values of T is this derivative positive, and what does this mean for the pepulation? For what values of T is it negative, and what does this mean for the pOpulation? You should discuss two different intervals of T in your answer. Consider using particular values of T, Y, and Y ' to help with your interpretations. (b) Now answer the same questions for the second derivative. What is the meaning of Y \"WWhen is it positive, and what does this mean for the population? When is it negative, and what does this mean for the population? This time, take into account the sign of the rst derivative in each interpretation. You should discuss three different intervals for T in your answer. Consider using particular values of T, Y, Y ', and Y \" to help with your interpretations. 'l' '.) Igl | A'JReadaloud | V Draw V 'p' nghllght 5. Now assume that this curve, in theory, describes the behavior of Covid-19 over its lifetime so far.In particular, we can use data on New York City, from this website, to measure Y, the number of cases (click on "Cases"): https : //www1 .nyc.gov / site / doh / covid / covid- 19datatrends.page #epicurve This link is also posted in Courseworks under this Assignment. (a) Click on "Get the Data" on put the data into an excel le. In what units is T measured? (b) Use the 7-day average. Calculate an estimate of the "slope," or derivative, of the Curve as the standard "rise" over "run" at each point. Do the same fer the "s10pe" of the "slepe," or the second derivative. Include a screenshot of your excel le The numbers for the roots, turning points, and POI's won't match up with the function (1) in question 4, but think about the general shape of that curve, and of the graph on the website, and use the derivatives yOu calCulated to answer the following questiOns. (c) According to this data, which dates would you classify as the worst phase of the disease so far? That is, when were New Yorkers in the most danger of getting sick from covid? Explain, using using the shape of the curve; and the derivatives you calculated, and their meanings. (d) According to this data, which dates would you classify as the best phase of the disease so far? That is, when were New Yorkers the safest? Explain, using the shape of the curve; and the derivatives you calculated, and their meanings. (e) According to this data, how should residents of New York City be feeling about the spread of the disease now (say, the last two to three weeks of data)? Explain, using the shape of the curve; and the derivatives you calculated, and their meanings