Answered step by step
Verified Expert Solution
Link Copied!

Question

00
1 Approved Answer

= 1. Consider an open economy given by the following. Production Function: Y = 10K;(L), Consumption Function: Ct = 120 + 6Y dt, Investment Function:

image text in transcribedimage text in transcribed

= 1. Consider an open economy given by the following. Production Function: Y = 10K;"(L), Consumption Function: Ct = 120 + 6Y dt, Investment Function: I1 = 250 - 1000rt, Demand for Money: L 4Y, Net Exports Schedule: NX = 90 - 3. In addition suppose that at time t = 0 the economy is in a steady state and the following are true. (For simplicity assume population growth and technological growth are zero; i.e., n = 0 and g=0.) Aggregate Capital Stock: Ko = 100, Aggregate Labor Supply: T. = 100, Government Spending: Go 200, Tax Collections: T. 200, World Interest Rate: ro .08, Foreign Price Level: Po 8, Money Supply: Mo = 8000. = = = = (a) Find the equilibrium level of output, consumption, investment and net exports and diagram the goods market situation for time t = 0. (b) Find the equilibrium level of private savings, government savings and net foreign investment and diagram the loanable funds market situation for time t=0. (c) Find the equilibrium supply and demand for currency and diagram the currency market situation for time t = 0. (d) Find the nominal exchange rate at time t = 0. (e) How does this illustrate the classical dichotomy? (f) Explain what will happen to the trade balance, the real exchange rate and the nominal exchange rate in the long run if the government decreases spending. (g) Explain what will happen to the trade balance, the real exchange rate and the nominal exchange rate in the long run if the central bank decreases the money supply. 2. Consider the following Keynesian model of the economy. Consumption Function: C = 16 + 6Yd, Investment Function: I = 30 50r, Government Spending: G = 25, Tax Collections: T 25, Money Demand Function: Ld = 2Y - 200r, Money Supply: M = 524, Price Level: P = 2. = (a) Find an expression for the IS curve and plot it. (b) Find an expression for the LM curve and plot it. (c) Find the short run equilibrium level of output and real interest rates. Suppose that the government decides to stimulate the economy by increasing the level of government spending to G=26. (Leave T = 25 and M = 524.) (d) Find an expression for the new IS curve. (e) Draw a graph of the new IS curve on the same diagram with the old IS curve and the old LM curve. (f) Looking at your graph, what do you expect will happen in the short run to output and real interest rates? (g) Verify your previous answers by computing the short run equilibrium level of output and real interest rates. Suppose that the Federal Reserve Bank decides to stimulate the economy by increasing the money supply to M = 540. (Leave T = 25 and G = 25.) (h) Find an expression for the new LM curve. (i) Draw a graph of the new LM curve on the same diagram with the old IS curve and the old LM curve. (j) Looking at your graph, what do you expect will happen in the short run to output and real interest rates? (k) Verify your previous answers by computing the short run equilibrium level of output and real interest rates. = 1. Consider an open economy given by the following. Production Function: Y = 10K;"(L), Consumption Function: Ct = 120 + 6Y dt, Investment Function: I1 = 250 - 1000rt, Demand for Money: L 4Y, Net Exports Schedule: NX = 90 - 3. In addition suppose that at time t = 0 the economy is in a steady state and the following are true. (For simplicity assume population growth and technological growth are zero; i.e., n = 0 and g=0.) Aggregate Capital Stock: Ko = 100, Aggregate Labor Supply: T. = 100, Government Spending: Go 200, Tax Collections: T. 200, World Interest Rate: ro .08, Foreign Price Level: Po 8, Money Supply: Mo = 8000. = = = = (a) Find the equilibrium level of output, consumption, investment and net exports and diagram the goods market situation for time t = 0. (b) Find the equilibrium level of private savings, government savings and net foreign investment and diagram the loanable funds market situation for time t=0. (c) Find the equilibrium supply and demand for currency and diagram the currency market situation for time t = 0. (d) Find the nominal exchange rate at time t = 0. (e) How does this illustrate the classical dichotomy? (f) Explain what will happen to the trade balance, the real exchange rate and the nominal exchange rate in the long run if the government decreases spending. (g) Explain what will happen to the trade balance, the real exchange rate and the nominal exchange rate in the long run if the central bank decreases the money supply. 2. Consider the following Keynesian model of the economy. Consumption Function: C = 16 + 6Yd, Investment Function: I = 30 50r, Government Spending: G = 25, Tax Collections: T 25, Money Demand Function: Ld = 2Y - 200r, Money Supply: M = 524, Price Level: P = 2. = (a) Find an expression for the IS curve and plot it. (b) Find an expression for the LM curve and plot it. (c) Find the short run equilibrium level of output and real interest rates. Suppose that the government decides to stimulate the economy by increasing the level of government spending to G=26. (Leave T = 25 and M = 524.) (d) Find an expression for the new IS curve. (e) Draw a graph of the new IS curve on the same diagram with the old IS curve and the old LM curve. (f) Looking at your graph, what do you expect will happen in the short run to output and real interest rates? (g) Verify your previous answers by computing the short run equilibrium level of output and real interest rates. Suppose that the Federal Reserve Bank decides to stimulate the economy by increasing the money supply to M = 540. (Leave T = 25 and G = 25.) (h) Find an expression for the new LM curve. (i) Draw a graph of the new LM curve on the same diagram with the old IS curve and the old LM curve. (j) Looking at your graph, what do you expect will happen in the short run to output and real interest rates? (k) Verify your previous answers by computing the short run equilibrium level of output and real interest rates

Step by Step Solution

There are 3 Steps involved in it

Step: 1

blur-text-image

Get Instant Access with AI-Powered Solutions

See step-by-step solutions with expert insights and AI powered tools for academic success

Step: 2

blur-text-image

Step: 3

blur-text-image

Ace Your Homework with AI

Get the answers you need in no time with our AI-driven, step-by-step assistance

Get Started

Recommended Textbook for

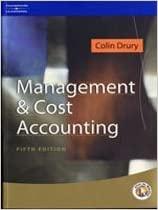
Management And Cost Accounting

Authors: Colin Drury

5th Edition

1861525362, 978-1861525369

Students also viewed these Accounting questions