Answered step by step
Verified Expert Solution
Question
1 Approved Answer
1. Consider monthly demand for the ABC Corporation, as shown in Table 7.3. Forecast the monthly demand for Year 6 using the static method for
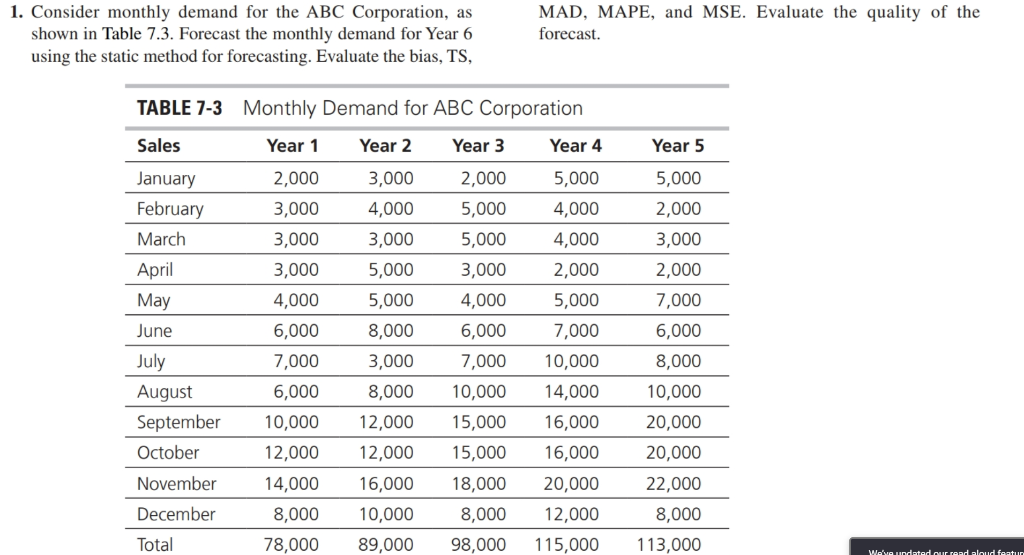
1. Consider monthly demand for the ABC Corporation, as shown in Table 7.3. Forecast the monthly demand for Year 6 using the static method for forecasting. Evaluate the bias, TS, MAD, MAPE, and MSE. Evaluate the quality of the forecast. TABLE 7-3 Monthly Demand for ABC Corporation Sales Year 1 Year 2 Year 3 Year 4 Year 5 January February March April May June 2,000 3,000 3,000 3,000 4,000 6,000 7,000 6,000 10,000 12,000 14,000 8,000 78,000 July August September October 3,000 4,000 3,000 5,000 5,000 8,000 3,000 8,000 12,000 12,000 16,000 10,000 89,000 2,000 5,000 5,000 3,000 4,000 6,000 7,000 10,000 15,000 15,000 18,000 8,000 98,000 5,000 2,000 3,000 2,000 7,000 6,000 8,000 10,000 5,000 4,000 4,000 2,000 5,000 7,000 10,000 14,000 16,000 16,000 20,000 12,000 115,000 20,000 November December 20,000 22,000 8,000 113,000 Total We'va undated our read aloud faptur 2. (20 pts) Refer to the data set in Exercise 1 on page 200 of the textbook. a) Forecast the monthly demand for Year 6 using the trend projection only. (2 pts) What are the values of MAD, MAPE, MSE, and TS? (4 pts) b) Forecast the monthly demand for Year 6 using the trend & seasonality adjustment. (4 pts) What are the seasonal factors for each month? (2 pts) What are the values of MAD, MAPE, MSE, and TS? (4 pts) c) Based on your analysis, should you consider the seasonality in the forecast? Why? (4 pts)
Step by Step Solution
There are 3 Steps involved in it
Step: 1
Get Instant Access to Expert-Tailored Solutions
See step-by-step solutions with expert insights and AI powered tools for academic success
Step: 2
Step: 3
Ace Your Homework with AI
Get the answers you need in no time with our AI-driven, step-by-step assistance
Get Started