

Answered step by step
Verified Expert Solution
Question
1 Approved Answer
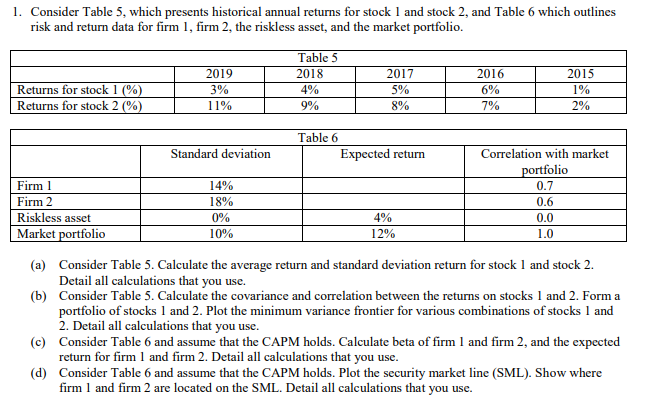
1. Consider Table 5, which presents historical annual returns for stock 1 and stock 2, and Table 6 which outlines risk and return data for
Step by Step Solution
There are 3 Steps involved in it
Step: 1

Get Instant Access to Expert-Tailored Solutions
See step-by-step solutions with expert insights and AI powered tools for academic success
Step: 2

Step: 3
Ace Your Homework with AI
Get the answers you need in no time with our AI-driven, step-by-step assistance
Get Started
The ACT Guide To Ethical Conflicts In Finance
Authors: Andreas Prindl, Bimal Prodhan
1st Edition
1855732564, 978-1855732568