

Answered step by step
Verified Expert Solution
Question
1 Approved Answer
1) Consider the amplitude-modulated signal: SAN (1) = A[1+ucos(0,1)]cos(011) Use MATLAB command and M files to draw the modulated signal and the demodulated signal for
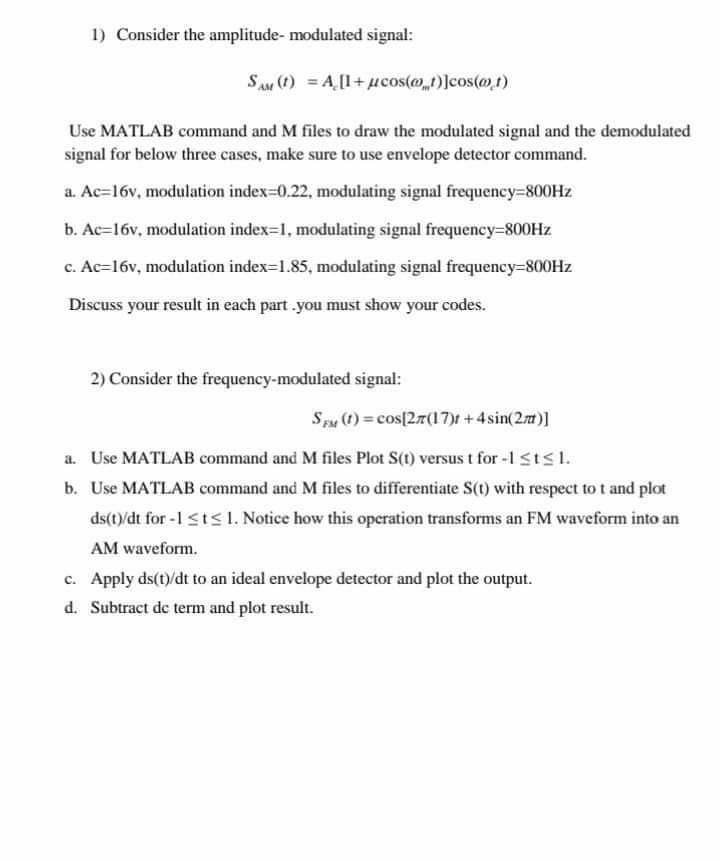
1) Consider the amplitude-modulated signal: SAN (1) = A[1+ucos(0,1)]cos(011) Use MATLAB command and M files to draw the modulated signal and the demodulated signal for below three cases, make sure to use envelope detector command. a. Ac=16v, modulation index=0.22, modulating signal frequency=800Hz b. Ac=16v, modulation index=1, modulating signal frequency=800Hz c. Ac=16v, modulation index=1.85, modulating signal frequency=800Hz Discuss your result in each part.you must show your codes. 2) Consider the frequency-modulated signal: SFX (1) = cos(27 (17+ 4 sin(2.70)] a. Use MATLAB command and M files Plot S(t) versus t for-1 St
Step by Step Solution
There are 3 Steps involved in it
Step: 1

Get Instant Access to Expert-Tailored Solutions
See step-by-step solutions with expert insights and AI powered tools for academic success
Step: 2

Step: 3
Ace Your Homework with AI
Get the answers you need in no time with our AI-driven, step-by-step assistance
Get Started
Database Concepts
Authors: David Kroenke, David J. Auer
3rd Edition
0131986252, 978-0131986251