Answered step by step
Verified Expert Solution
Question
1 Approved Answer
1 Consider the correlations among children's test scores shown in Table 6.1. An approximate solution to the factor analysis equations gives 0.95 0.89 A =
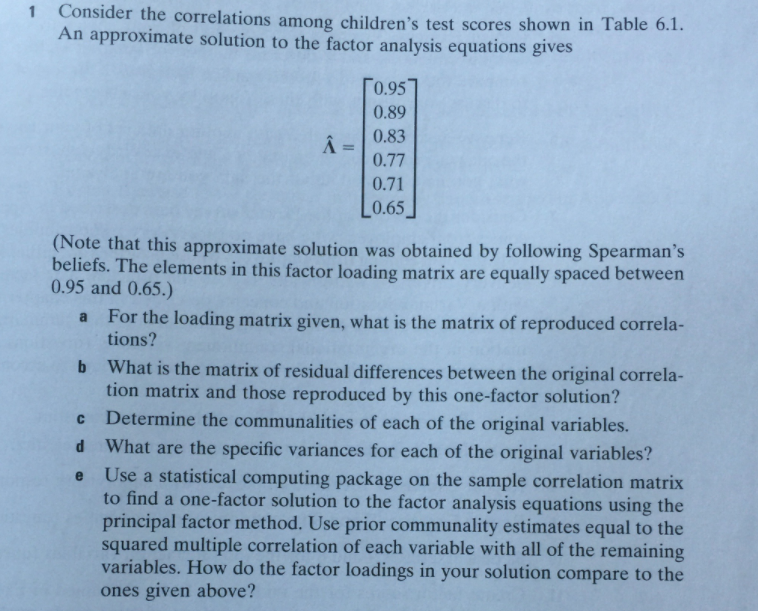
1 Consider the correlations among children's test scores shown in Table 6.1. An approximate solution to the factor analysis equations gives 0.95 0.89 A = 0.83 0.77 0.71 0.65 (Note that this approximate solution was obtained by following Spearman's beliefs. The elements in this factor loading matrix are equally spaced between 0.95 and 0.65.) a For the loading matrix given, what is the matrix of reproduced correla- tions? b What is the matrix of residual differences between the original correla- tion matrix and those reproduced by this one-factor solution? c Determine the communalities of each of the original variables. d What are the specific variances for each of the original variables? e Use a statistical computing package on the sample correlation matrix to find a one-factor solution to the factor analysis equations using the principal factor method. Use prior communality estimates equal to the squared multiple correlation of each variable with all of the remaining variables. How do the factor loadings in your solution compare to the ones given above
Step by Step Solution
There are 3 Steps involved in it
Step: 1
Get Instant Access to Expert-Tailored Solutions
See step-by-step solutions with expert insights and AI powered tools for academic success
Step: 2
Step: 3
Ace Your Homework with AI
Get the answers you need in no time with our AI-driven, step-by-step assistance
Get Started