Answered step by step
Verified Expert Solution
Question
1 Approved Answer
1. Consider the CuAg phase diagram. riyure 3.0 ine copper-suiver pnase alagram. (Adapted from Metals Handbook: Metallography, Structures and Phase Diagrams, Vol.8,8th edition, ASM Handbook
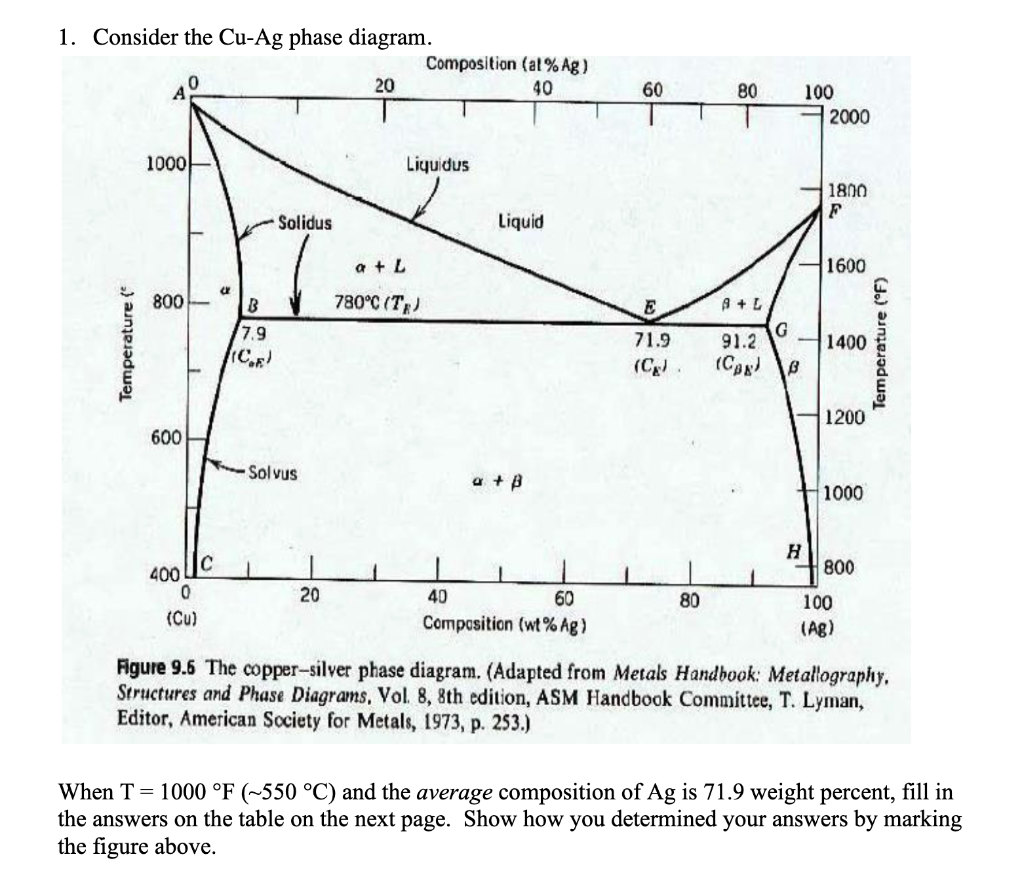
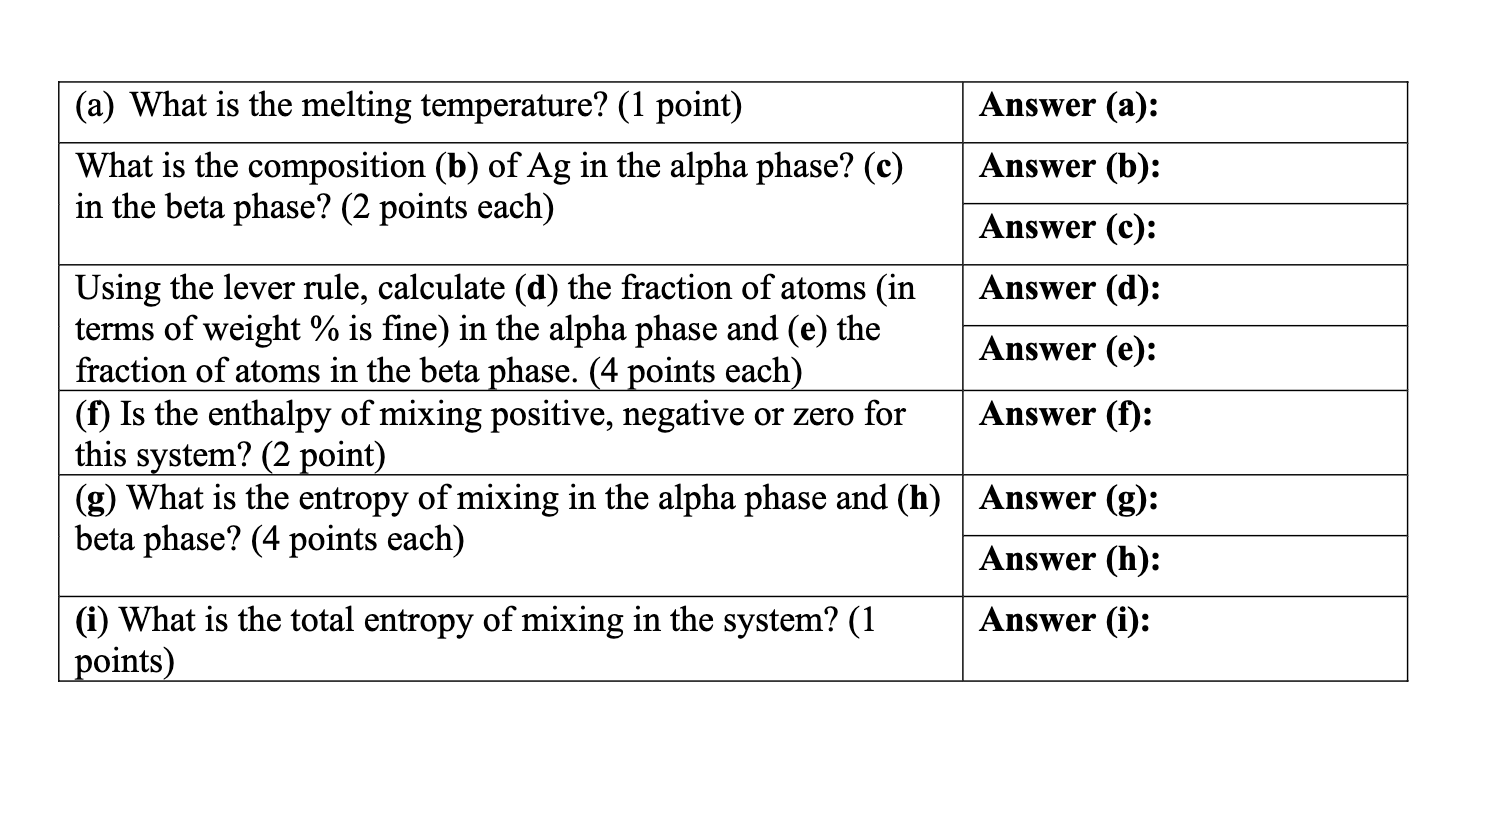
1. Consider the CuAg phase diagram. riyure 3.0 ine copper-suiver pnase alagram. (Adapted from Metals Handbook: Metallography, Structures and Phase Diagrams, Vol.8,8th edition, ASM Handbook Committee, T. Lyman, Editor, American Society for Metals, 1973, p. 253.) When T=1000F(550C) and the average composition of Ag is 71.9 weight percent, fill in the answers on the table on the next page. Show how you determined your answers by marking the figure above. \begin{tabular}{|l|l|} \hline (a) What is the melting temperature? (1 point) & Answer (a): \\ \hline \multirow{2}{*}{Whatisthecomposition(b)ofAginthealphaphase?(c)inthebetaphase?(2pointseach)} & Answer (b): \\ \cline { 2 - 3 } & Answer (c): \\ \hline Usingtheleverrule,calculate(d)thefractionofatoms(intermsofweight%isfine)inthealphaphaseand(e)thefractionofatomsinthebetaphase.(4pointseach) & Answer (d): \\ \cline { 2 - 3 } (f)Istheenthalpyofmixingpositive,negativeorzeroforthissystem?(2point) & Answer (e): \\ \hline (g)Whatistheentropyofmixinginthealphaphaseand(h):betaphase?(4pointseach) & Answer (g): \\ \cline { 2 - 3 } & Answer (h): \\ \hline (i)Whatisthetotalentropyofmixinginthesystem?(1points) & Answer (i): \\ \hline \end{tabular}
Step by Step Solution
There are 3 Steps involved in it
Step: 1
Get Instant Access to Expert-Tailored Solutions
See step-by-step solutions with expert insights and AI powered tools for academic success
Step: 2
Step: 3
Ace Your Homework with AI
Get the answers you need in no time with our AI-driven, step-by-step assistance
Get Started