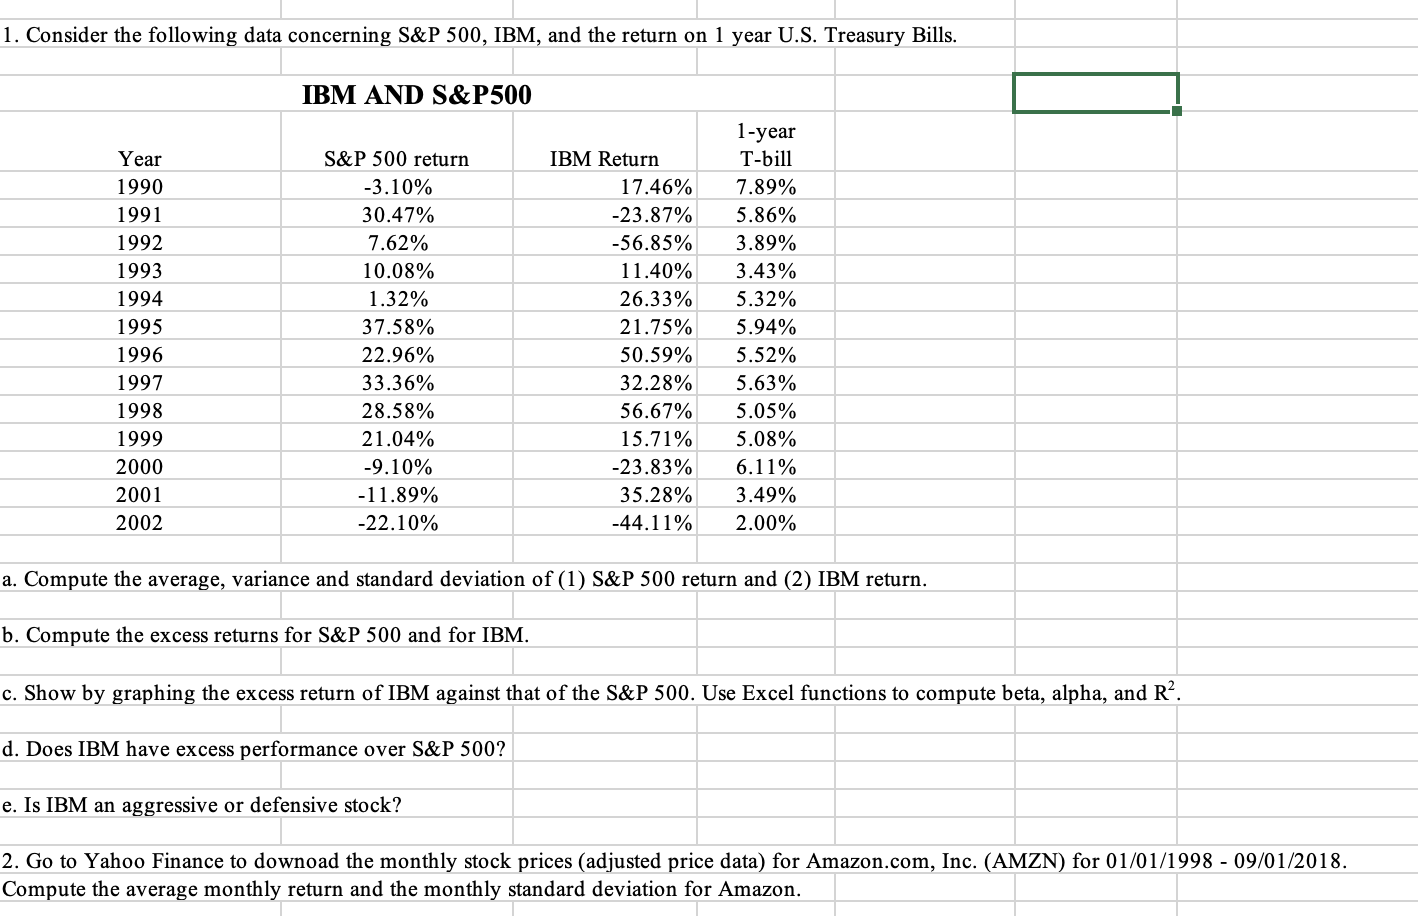
1. Consider the following data concerning S&P 500, IBM, and the return on 1 year U.S. Treasury Bills. IBM AND S&P500 Year 1990 1991 1992 1993 1994 1995 1996 1997 1998 1999 2000 2001 2002 S&P 500 return -3.10% 30.47% 7.62% 10.08% 1.32% 37.58% 22.96% 33.36% 28.58% 21.04% -9.10% -11.89% -22.10% IBM Return 17.46% -23.87% -56.85% 11.40% 26.33% 21.75% 50.59% 32.28% 56.67% 15.71% -23.83% 35.28% -44.11% 1-year T-bill 7.89% 5.86% 3.89% 3.43% 5.32% 5.94% 5.52% 5.63% 5.05% 5.08% 6.11% 3.49% 2.00% a. Compute the average, variance and standard deviation of (1) S&P 500 return and (2) IBM return. b. Compute the excess returns for S&P 500 and for IBM. c. Show by graphing the excess return of IBM against that of the S&P 500. Use Excel functions to compute beta, alpha, and R?. d. Does IBM have excess performance over S&P 500? e. Is IBM an aggressive or defensive stock? 2. Go to Yahoo Finance to downoad the monthly stock prices (adjusted price data) for Amazon.com, Inc. (AMZN) for 01/01/1998 - 09/01/2018. Compute the average monthly return and the monthly standard deviation for Amazon. 1. Consider the following data concerning S&P 500, IBM, and the return on 1 year U.S. Treasury Bills. IBM AND S&P500 Year 1990 1991 1992 1993 1994 1995 1996 1997 1998 1999 2000 2001 2002 S&P 500 return -3.10% 30.47% 7.62% 10.08% 1.32% 37.58% 22.96% 33.36% 28.58% 21.04% -9.10% -11.89% -22.10% IBM Return 17.46% -23.87% -56.85% 11.40% 26.33% 21.75% 50.59% 32.28% 56.67% 15.71% -23.83% 35.28% -44.11% 1-year T-bill 7.89% 5.86% 3.89% 3.43% 5.32% 5.94% 5.52% 5.63% 5.05% 5.08% 6.11% 3.49% 2.00% a. Compute the average, variance and standard deviation of (1) S&P 500 return and (2) IBM return. b. Compute the excess returns for S&P 500 and for IBM. c. Show by graphing the excess return of IBM against that of the S&P 500. Use Excel functions to compute beta, alpha, and R?. d. Does IBM have excess performance over S&P 500? e. Is IBM an aggressive or defensive stock? 2. Go to Yahoo Finance to downoad the monthly stock prices (adjusted price data) for Amazon.com, Inc. (AMZN) for 01/01/1998 - 09/01/2018. Compute the average monthly return and the monthly standard deviation for Amazon


