

Answered step by step
Verified Expert Solution
Question
1 Approved Answer
1. Consider the following pooled cross sectional dataset: You are interested in the causal effect of X on Y: Unique id Year X Detrended Detrended
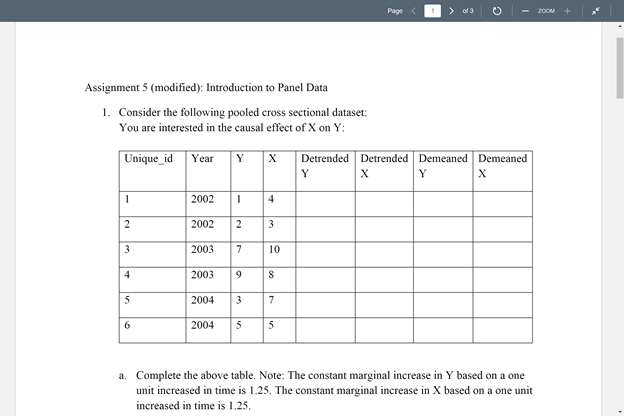
1. Consider the following pooled cross sectional dataset: You are interested in the causal effect of X on Y: Unique id Year X Detrended Detrended Demeaned Demeaned Y X Y 1 2002 1 4 2. 2002 2 3 3 2003 7 10 4 2003 9 8 5 2004 3 7 6 2004 5 5 one a. Complete the above table. Note: The constant marginal increase in Y based on unit increased in time is 1.25. The constant marginal increase in X based on a one unit increased in time is 1.25. b. Below is a regression result of Y Detrended on Detrended X. Based on this model, what is our estimate of the effect of X on Y? reg y_detrended x_detrended Source SS df MS = 1 Model Residual 22.3053938 18.9446062 22.3053938 4.73615156 Number of obs F(1, 4) Prob > F R-squared Adj R-squared Root MSE 6 4.71 0.0958 0.5407 0.4259 2.1763 4 Total 41.25 5 8.25 Y_detrended Coef. Std. Err. t P>It! [95% Conf. Interval] x_detrended cons .8833819 1.32e-08 .4070581 .8884585 2.17 0.00 0.096 1.000 -.2467924 -2.466756 2.013556 2.466756 c. What regression model is equivalent to the regression Y Detrended on X Detrended? d. Expand your model to include year dummies: e. If you estimated this model in (d), what would be your estimator for the marginal effect of X on Y? f. Explain why your estimator in (d) differs from what is estimated in (b)? Which model do you believe satisfies the required assumption for unbiasedness (i.e., which model should you believe)? Page 2DOM + Assignment 5 (modified): Introduction to Panel Data 1. Consider the following pooled cross sectional dataset: You are interested in the causal effect of X on Y: Unique_id Year Y X Detrended Detrended Demeaned Demeaned Y X X 1 2002 1 4 2 2002 2 3 3 2003 7 10 4 2003 9 8 S 2004 3 7 6 2004 5 5 a. Complete the above table. Note: The constant marginal increase in Y based on a one unit increased in time is 1.25. The constant marginal increase in X based on a one unit increased in time is 1.25. 1. Consider the following pooled cross sectional dataset: You are interested in the causal effect of X on Y: Unique id Year X Detrended Detrended Demeaned Demeaned Y X Y 1 2002 1 4 2. 2002 2 3 3 2003 7 10 4 2003 9 8 5 2004 3 7 6 2004 5 5 one a. Complete the above table. Note: The constant marginal increase in Y based on unit increased in time is 1.25. The constant marginal increase in X based on a one unit increased in time is 1.25. b. Below is a regression result of Y Detrended on Detrended X. Based on this model, what is our estimate of the effect of X on Y? reg y_detrended x_detrended Source SS df MS = 1 Model Residual 22.3053938 18.9446062 22.3053938 4.73615156 Number of obs F(1, 4) Prob > F R-squared Adj R-squared Root MSE 6 4.71 0.0958 0.5407 0.4259 2.1763 4 Total 41.25 5 8.25 Y_detrended Coef. Std. Err. t P>It! [95% Conf. Interval] x_detrended cons .8833819 1.32e-08 .4070581 .8884585 2.17 0.00 0.096 1.000 -.2467924 -2.466756 2.013556 2.466756 c. What regression model is equivalent to the regression Y Detrended on X Detrended? d. Expand your model to include year dummies: e. If you estimated this model in (d), what would be your estimator for the marginal effect of X on Y? f. Explain why your estimator in (d) differs from what is estimated in (b)? Which model do you believe satisfies the required assumption for unbiasedness (i.e., which model should you believe)? Page 2DOM + Assignment 5 (modified): Introduction to Panel Data 1. Consider the following pooled cross sectional dataset: You are interested in the causal effect of X on Y: Unique_id Year Y X Detrended Detrended Demeaned Demeaned Y X X 1 2002 1 4 2 2002 2 3 3 2003 7 10 4 2003 9 8 S 2004 3 7 6 2004 5 5 a. Complete the above table. Note: The constant marginal increase in Y based on a one unit increased in time is 1.25. The constant marginal increase in X based on a one unit increased in time is 1.25
Step by Step Solution
There are 3 Steps involved in it
Step: 1

Get Instant Access to Expert-Tailored Solutions
See step-by-step solutions with expert insights and AI powered tools for academic success
Step: 2

Step: 3
Ace Your Homework with AI
Get the answers you need in no time with our AI-driven, step-by-step assistance
Get Started
Marketing For Small B2b Businesses
Authors: Andrew Schulkind
1st Edition
1484287436, 978-1484287439