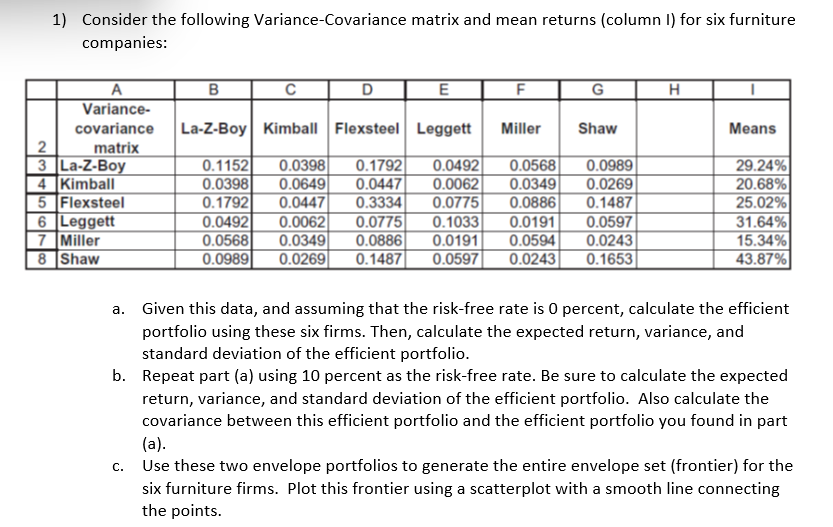
1) Consider the following Variance-Covariance matrix and mean returns (column 1) for six furniture companies: B D E F G La-Z-Boy Kimball Flexsteel Leggett Miller Shaw Means A Variance- covariance 2 matrix 3 La-z-Boy 4 Kimball 5 Flexsteel 6 Leggett 7 Miller 8 Shaw 0.1152 0.0398 0.1792 0.0492 0.0568 0.0989 0.0398 0.0649 0.0447 0.0062 0.0349 0.0269 0.1792 0.0447 0.3334 0.0775 0.0886 0.1487 0.0492 0.0062 0.0775 0.1033 0.0191 0.0597 0.0568 0.0349 0.0886 0.0191 0.0594 0.0243 0.0989 0.0269 0.1487 0.0597 0.0243 0.1653 29.24% 20.68% 25.02% 31.64% 15.34% 43.87% a. Given this data, and assuming that the risk-free rate is 0 percent, calculate the efficient portfolio using these six firms. Then, calculate the expected return, variance, and standard deviation of the efficient portfolio. b. Repeat part (a) using 10 percent as the risk-free rate. Be sure to calculate the expected return, variance, and standard deviation of the efficient portfolio. Also calculate the covariance between this efficient portfolio and the efficient portfolio you found in part (a). c. Use these two envelope portfolios to generate the entire envelope set (frontier) for the six furniture firms. Plot this frontier using a scatterplot with a smooth line connecting the points. 1) Consider the following Variance-Covariance matrix and mean returns (column 1) for six furniture companies: B D E F G La-Z-Boy Kimball Flexsteel Leggett Miller Shaw Means A Variance- covariance 2 matrix 3 La-z-Boy 4 Kimball 5 Flexsteel 6 Leggett 7 Miller 8 Shaw 0.1152 0.0398 0.1792 0.0492 0.0568 0.0989 0.0398 0.0649 0.0447 0.0062 0.0349 0.0269 0.1792 0.0447 0.3334 0.0775 0.0886 0.1487 0.0492 0.0062 0.0775 0.1033 0.0191 0.0597 0.0568 0.0349 0.0886 0.0191 0.0594 0.0243 0.0989 0.0269 0.1487 0.0597 0.0243 0.1653 29.24% 20.68% 25.02% 31.64% 15.34% 43.87% a. Given this data, and assuming that the risk-free rate is 0 percent, calculate the efficient portfolio using these six firms. Then, calculate the expected return, variance, and standard deviation of the efficient portfolio. b. Repeat part (a) using 10 percent as the risk-free rate. Be sure to calculate the expected return, variance, and standard deviation of the efficient portfolio. Also calculate the covariance between this efficient portfolio and the efficient portfolio you found in part (a). c. Use these two envelope portfolios to generate the entire envelope set (frontier) for the six furniture firms. Plot this frontier using a scatterplot with a smooth line connecting the points


