Question
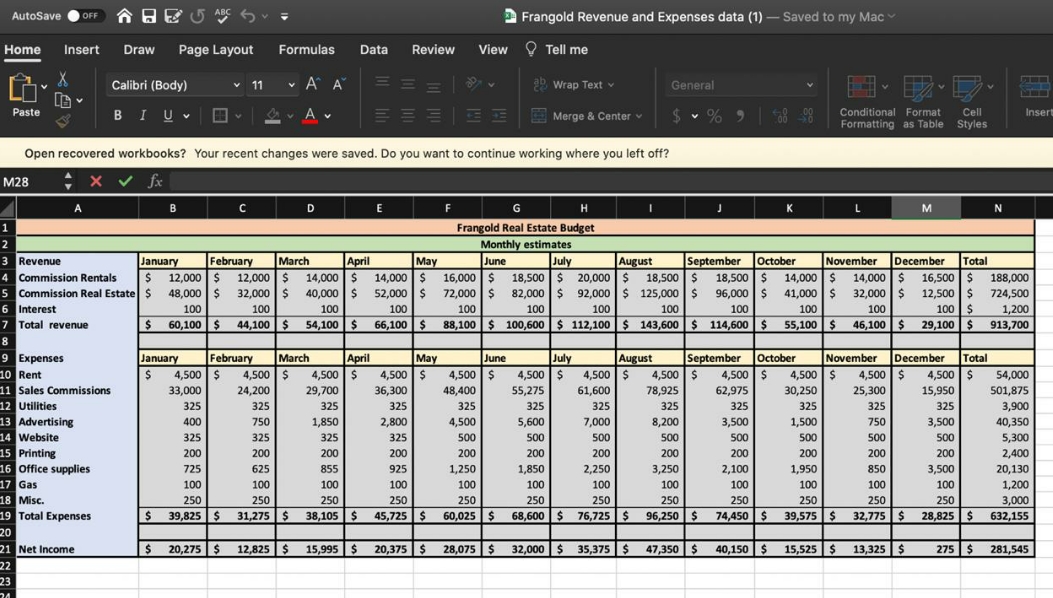
1. Construct a Pie Chart for the expenses for the total year. 2. Construct a Horizonal bar chart by month for Commission income items.3. Construct
1. Construct a Pie Chart for the expenses for the total year.
2. Construct a Horizonal bar chart by month for Commission income items.3. Construct a Vertical bar chart by month showing Total Income, Total Expenses, and Net Income.
4. construct a Stacked bar chart for expense items by month.5. Be creative and construct a Chart that you think would best show the data about Frangold Real Estate to its owners.6. Take either the Chart in number 2 or 3 and reverse the X and Y axis and place the new chart into a new worksheet. Hint: Change from Vertical to Horizontal Chart for Item 3 and from Horizontal to Vertical for Item 2.

AutoSave DOFF Frangold Revenue and Expenses data (1) - Saved to my Mac Home Insert Draw Page Layout Formulas Data Review View Tell me Calibri (Body) BI U 11 A A Wrap Text A Paste M28 Merge & Center Open recovered workbooks? Your recent changes were saved. Do you want to continue working where you left off? fx General A B D E G V % Conditional Format Formatting as Table Styles Cell Insert K M N Frangold Real Estate Budget 2 3 Revenue January February 4 Commission Rentals $ 5 Commission Real Estate $ 6 Interest 12,000 $ 48,000 $ 100 7 Total revenue $ 60,100 $ March April May 12,000 $ 14,000 $ 14,000 $ 32,000 $ 40,000 $ 52,000 $ 100 100 100 44,100 $ 54,100 $ 66,100 $ Monthly estimates June July August September 16,000 $ 18,500 $20,000 $ 18,500 $ 72,000 $82,000 $92,000 $125,000 $ October 18,500 $ 96,000 $ November December Total 100 100 100 100 88,100 $ 100,600 $112,100 $ 143,600 $ 114,600 $ 55,100 $ 46,100 $ 29,100 $ 913,700 100 14,000 $ 41,000 $ 100 14,000 $ 16,500 $ 188,000 32,000 $ 12,500 $ 724,500 100 100 $ 1,200 8 9 Expenses 10 Rent January February March April $ 4,500 $ 4,500 $ 4,500 $ 11 Sales Commissions 33,000 24,200 29,700 May 4,500 $ 36,300 June July August 12 Utilities 325 325 325 325 4,500 $ 48,400 325 325 September 4,500 $ 4,500 $ 4,500 $ 4,500 $ 4,500 55,275 61,600 78,925 62,975 30,250 325 October November December Total 25,300 $ 4,500 $ 4,500 $ 54,000 15,950 501,875 325 325 325 325 325 3,900 13 Advertising 400 750 1,850 2,800 4,500 5,600 7,000 8,200 3,500 1,500 750 3,500 40,350 14 Website 325 325 325 325 500 500 500 500 500 500 500 500 5,300 15 Printing 200 200 200 200 200 200 200 200 200 200 200 200 2,400 16 Office supplies 725 625 855 925 1,250 1,850 2,250 3,250 2,100 1,950 850 3,500 20,130 17 Gas 100 100 100 100 100 100 100 100 100 100 100 100 1,200 18 Misc. 250 250 250 250 250 250 250 250 250 250 250 19 Total Expenses $ 39,825 $ 31,275 $ 38,105 $ 45,725 $ 60,025 $ 68,600 $ 76,725 $ 96,250 $ 74,450 $ 39,575 $ 32,775 $ 250 28,825 $ 3,000 632,155 20 21 Net Income $ 20,275 $ 12,825 $ 15,995 $ 20,375 $ 28,075 $ 32,000 $35,375 | $ 47,350 $ 40,150 $ 15,525 $ 13,325 $ 275 $ 281,545 22 23 21
Step by Step Solution
There are 3 Steps involved in it
Step: 1

Get Instant Access to Expert-Tailored Solutions
See step-by-step solutions with expert insights and AI powered tools for academic success
Step: 2

Step: 3

Ace Your Homework with AI
Get the answers you need in no time with our AI-driven, step-by-step assistance
Get Started


