

Question
Comparative financial statements for Weller Corporation, a merchandising company, for the year ending December 31 appear below. The company did not issue any new
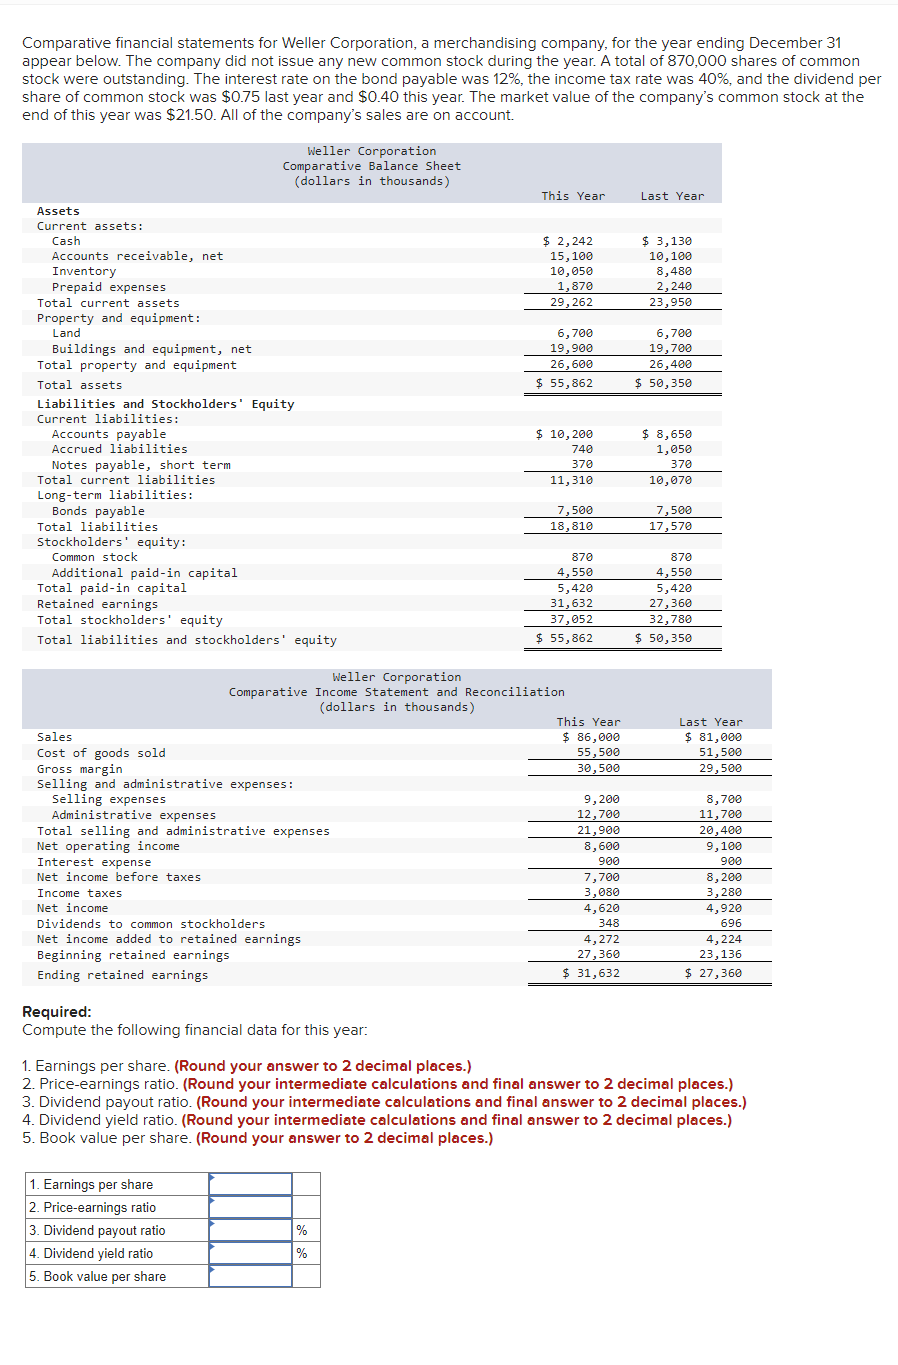
Comparative financial statements for Weller Corporation, a merchandising company, for the year ending December 31 appear below. The company did not issue any new common stock during the year. A total of 870,000 shares of common stock were outstanding. The interest rate on the bond payable was 12%, the income tax rate was 40%, and the dividend per share of common stock was $0.75 last year and $0.40 this year. The market value of the company's common stock at the end of this year was $21.50. All of the company's sales are on account. Weller Corporation Comparative Balance Sheet (dollars in thousands) Assets Current assets: Cash Accounts receivable, net Inventory Prepaid expenses Total current assets Property and equipment: Land Buildings and equipment, net Total property and equipment Total assets Liabilities and Stockholders' Equity Current liabilities: Accounts payable Accrued liabilities Notes payable, short term Total current liabilities Long-term liabilities: Bonds payable Total liabilities Stockholders' equity: Common stock Additional paid-in capital Total paid-in capital Retained earnings This Year Last Year $ 2,242 15,100 $ 3,130 10,100 10,050 8,480 1,870 2,240 29,262 23,950 6,700 6,700 19,900 26,600 $ 55,862 $ 50,350 19,700 26,400 $ 10,200 740 370 11,310 7,500 18,810 $ 8,650 1,050 370 10,070 7,500 17,570 870 870 4,550 4,550 5,420 5,420 31,632 27,360 37,052 32,780 $ 55,862 $ 50,350 Total stockholders' equity Total liabilities and stockholders' equity Weller Corporation Comparative Income Statement and Reconciliation (dollars in thousands) Sales Cost of goods sold Gross margin Selling and administrative expenses: Selling expenses Administrative expenses Total selling and administrative expenses Net operating income Interest expense Net income before taxes Income taxes Net income Dividends to common stockholders Net income added to retained earnings Beginning retained earnings Ending retained earnings Required: Compute the following financial data for this year: This Year $ 86,000 55,500 Last Year $ 81,000 51,500 29,500 30,500 9,200 8,700 12,700 11,700 21,900 8,600 900 20,400 9,100 900 7,700 8,200 3,080 3,280 4,620 4,920 348 696 4,272 27,360 4,224 23,136 $ 31,632 $ 27,360 1. Earnings per share. (Round your answer to 2 decimal places.) 2. Price-earnings ratio. (Round your intermediate calculations and final answer to 2 decimal places.) 3. Dividend payout ratio. (Round your intermediate calculations and final answer to 2 decimal places.) 4. Dividend yield ratio. (Round your intermediate calculations and final answer to 2 decimal places.) 5. Book value per share. (Round your answer to 2 decimal places.) 1. Earnings per share 2. Price-earnings ratio 3. Dividend payout ratio % 4. Dividend yield ratio % 5. Book value per share
Step by Step Solution
There are 3 Steps involved in it
Step: 1

Get Instant Access with AI-Powered Solutions
See step-by-step solutions with expert insights and AI powered tools for academic success
Step: 2

Step: 3
Ace Your Homework with AI
Get the answers you need in no time with our AI-driven, step-by-step assistance
Get Started
Auditing and Assurance Services An Applied Approach
Authors: Iris Stuart
1st edition
978-0073404004
