Answered step by step
Verified Expert Solution
Question
1 Approved Answer
1. Copy the table. Add a column to express the time of sunrise as a decimal value, rounded to 2 decimal places. Complete the table.
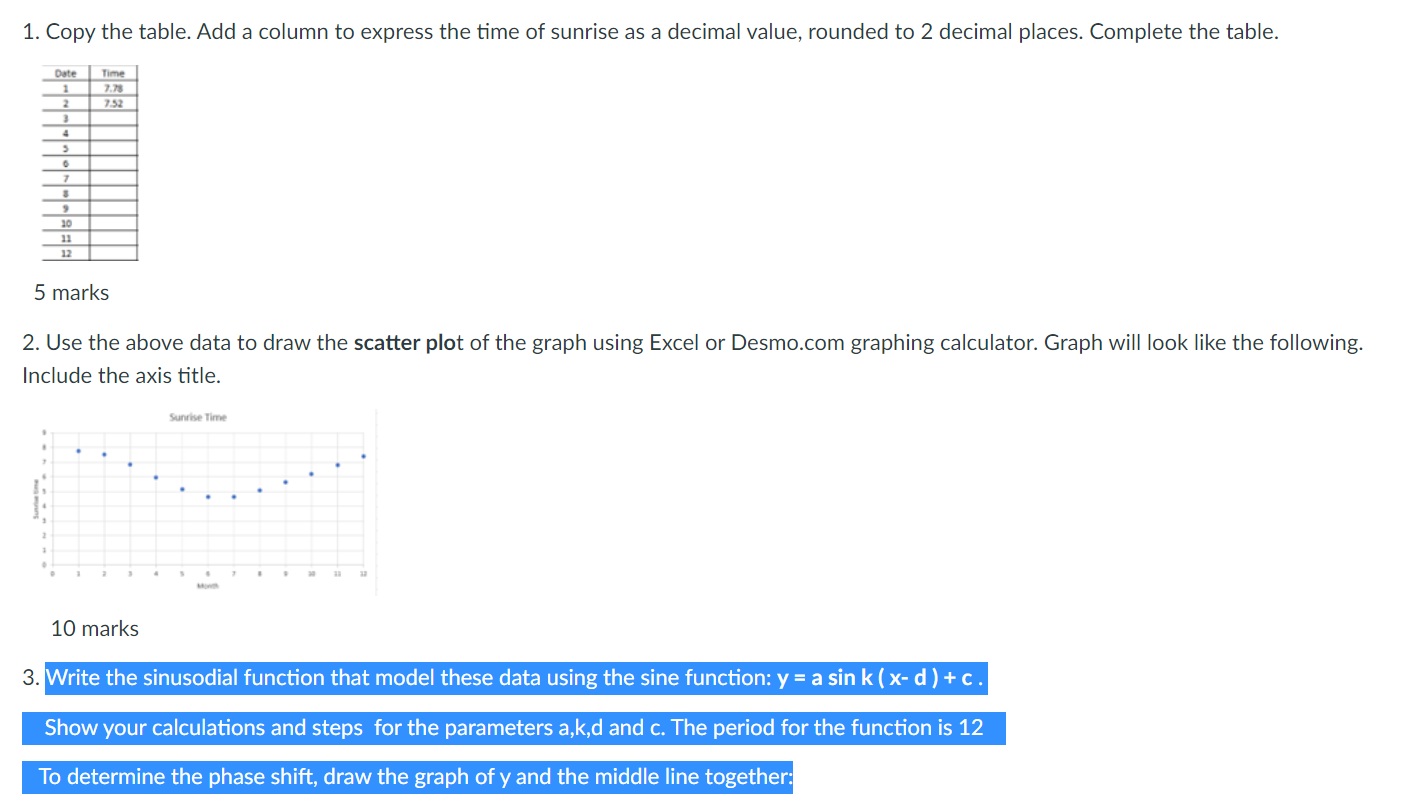
1. Copy the table. Add a column to express the time of sunrise as a decimal value, rounded to 2 decimal places. Complete the table. 2. Use the above data to draw the scatter plot of the graph using Excel or Desmo.com graphing calculator. Graph will look like the following. Include the axis title. 3. Write the sinusodial function that model these data using the sine function: y = a sin k l x- cl ) + c. Show your calculations and steps for the parameters a,k,d and c. The period for the function is 12 To determine the phase shift, draw the graph of y and the middle line together: 4. Draw the graph of your equation in part 3. Give the title and titles for the x and y axis. 15marks 4. Put the graphs from (1] and (3] on one chart. Comment on the ttness of the model function to the real data 15 marks 5. Use your model equation to estimate the sun rise time on June 15 5 marks
Step by Step Solution
There are 3 Steps involved in it
Step: 1
Get Instant Access to Expert-Tailored Solutions
See step-by-step solutions with expert insights and AI powered tools for academic success
Step: 2
Step: 3
Ace Your Homework with AI
Get the answers you need in no time with our AI-driven, step-by-step assistance
Get Started