Answered step by step
Verified Expert Solution
Link Copied!

Question

1 Approved Answer

1 ' ' ' Create a frequency table and a histogram for the average number of hours respondents spend watching TV each day
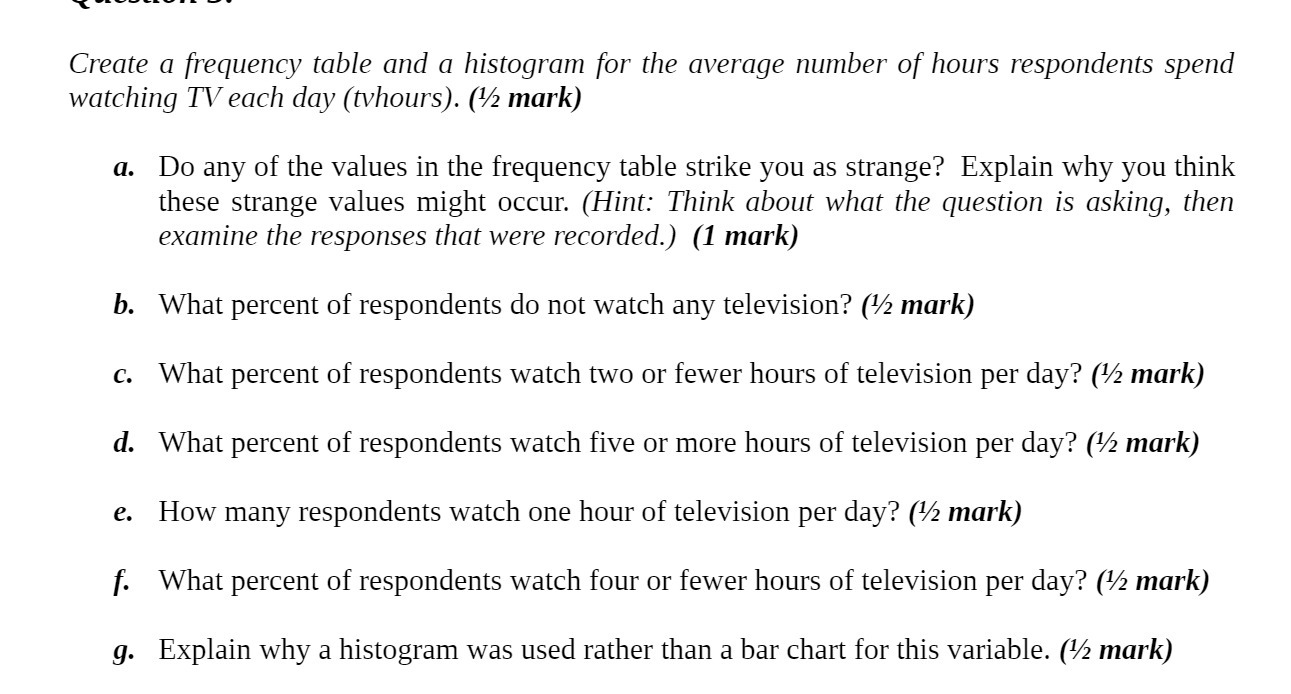
image text in transcribed
1 """"\"" ' " "' ' Create a frequency table and a histogram for the average number of hours respondents spend watching TV each day (tvhours). (1A2 mark) (I. Do any of the values in the frequency table strike you as strange? Explain why you think these strange values might occur. (Hint: Think about what the question is asking, then examine the responses that were recorded.) (1 mark) What percent of respondents do not watch any television? (1/2 mark) What percent of respondents watch two or fewer hours of television per day? (1/2 mark) What percent of respondents watch five or more hours of television per day? (1/2 mark) How many respondents watch one hour of television per day? (1/2 mark) What percent of respondents watch four or fewer hours of television per day? (1/2 mark) Explain why a histogram was used rather than a bar chart for this variable. (1/2 mark)

Step by Step Solution

There are 3 Steps involved in it

Step: 1

blur-text-image

Get Instant Access to Expert-Tailored Solutions

See step-by-step solutions with expert insights and AI powered tools for academic success

Step: 2

blur-text-image

Step: 3

blur-text-image

Ace Your Homework with AI

Get the answers you need in no time with our AI-driven, step-by-step assistance

Get Started

Recommended Textbook for

Algebra 2

Authors: Randall I. Charles, Basia Hall, Dan Kennedy, Laurie E Bass

Student Edition

0133500438, 978-0133500431

More Books

Students also viewed these Mathematics questions