

Question
1. Create a frequency table that relates to the number of locations (the y-axis variable) that have housing prices between dollar values (the x-axis variables).
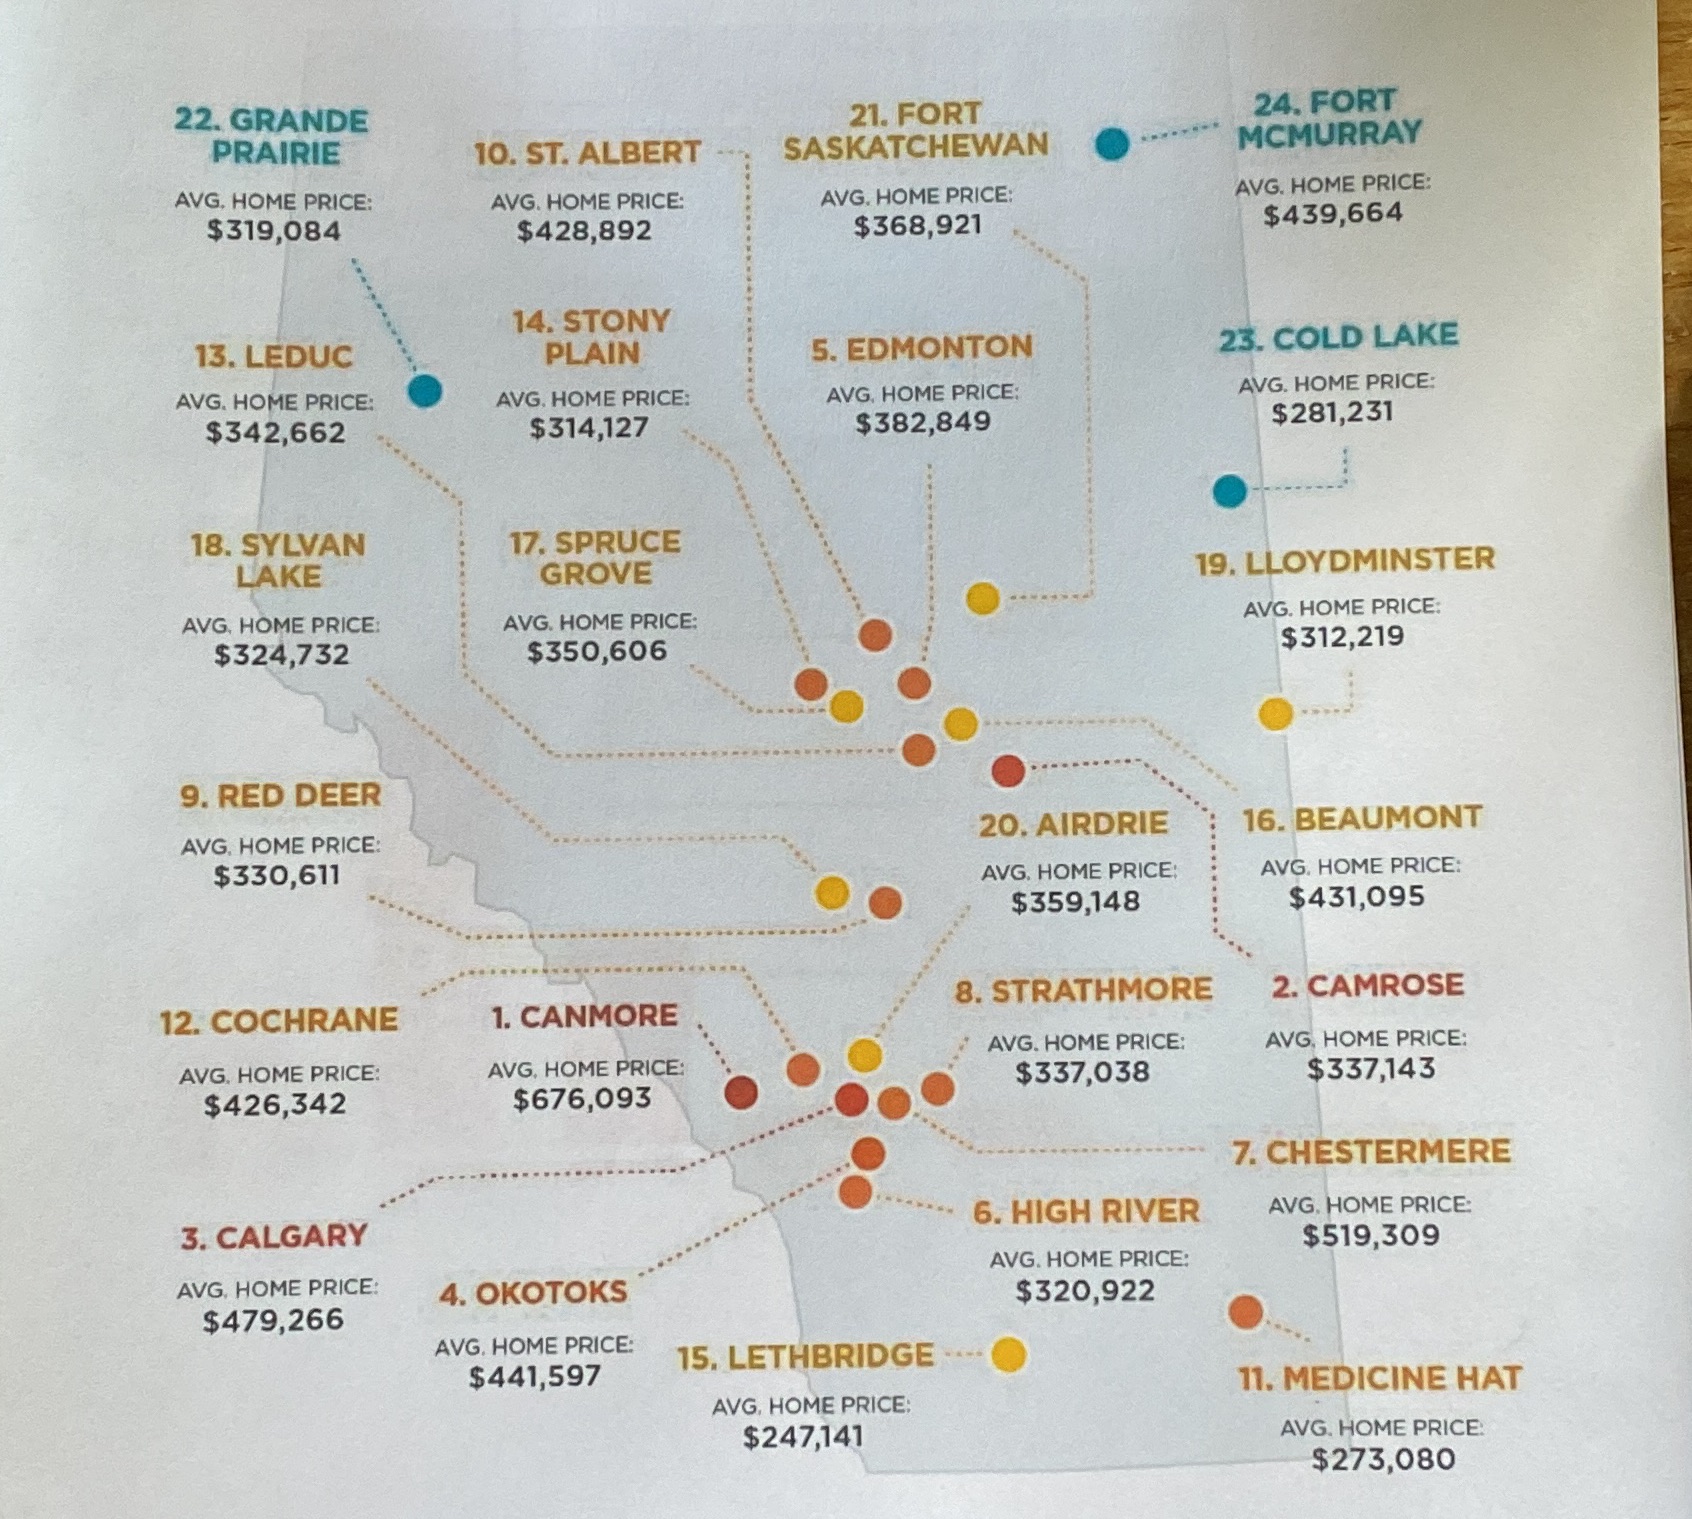
1. Create a frequency table that relates to the number of locations (the y-axis variable) that have housing prices between dollar values (the x-axis variables). For x-axis values, group the housing prices into the following:$200,000 to 300,000$300,000 to 400,000$400,000 to 500,000$500,000 to 6000,000$600,000 to $700,0002. Using the frequency table values (for L1 use the average of the housing prices in each range .i.e. For the $200,00 to $ 300,000 range use $250,000), determine the following:MeanMedianModeStandard Deviation 3. Using the mean and standard deviation values that you determined in #2, design a normal distribution curve. The numbers you use in the design of the curve can be rounded yo the nearest ten thousand.4. Select one location below the mean and determine the percentage of houses in these locations that are less expensive.
Step by Step Solution
There are 3 Steps involved in it
Step: 1

Get Instant Access to Expert-Tailored Solutions
See step-by-step solutions with expert insights and AI powered tools for academic success
Step: 2

Step: 3
Ace Your Homework with AI
Get the answers you need in no time with our AI-driven, step-by-step assistance
Get Started
Linear Algebra With Applications
Authors: Gareth Williams, Williams
9th Edition
1284120104, 9781284120103