

Answered step by step
Verified Expert Solution
Question
1 Approved Answer
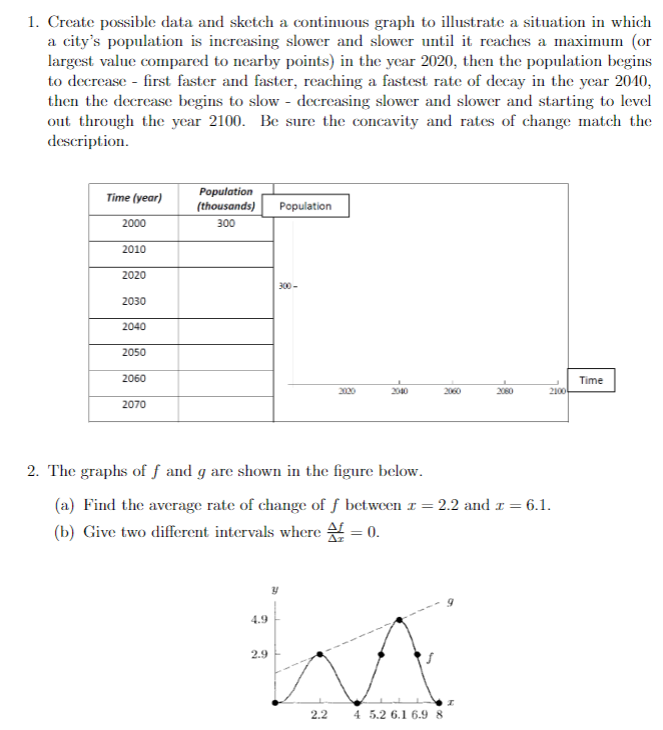
1. Create possible data and sketch a continnous graph to illustrate a situation in which a city's population is increasing slower and slower until it
Step by Step Solution
There are 3 Steps involved in it
Step: 1

Get Instant Access to Expert-Tailored Solutions
See step-by-step solutions with expert insights and AI powered tools for academic success
Step: 2

Step: 3
Ace Your Homework with AI
Get the answers you need in no time with our AI-driven, step-by-step assistance
Get Started
Larson Algebra 1 California
Authors: Ron Larson, Laurie Boswell, Timothy D. Kanold, Lee Stiff
1st Edition
0618811761, 9780618811762