1. Demonstrate how this decision problem can be optimised.
2. How does the optimal solution differ from the original allocation? What are the benefits?
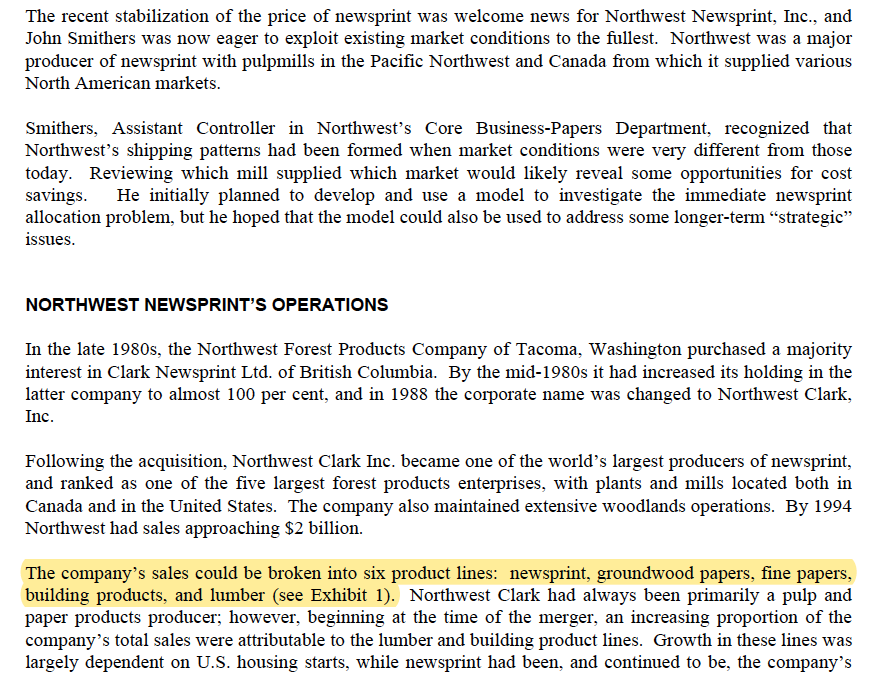
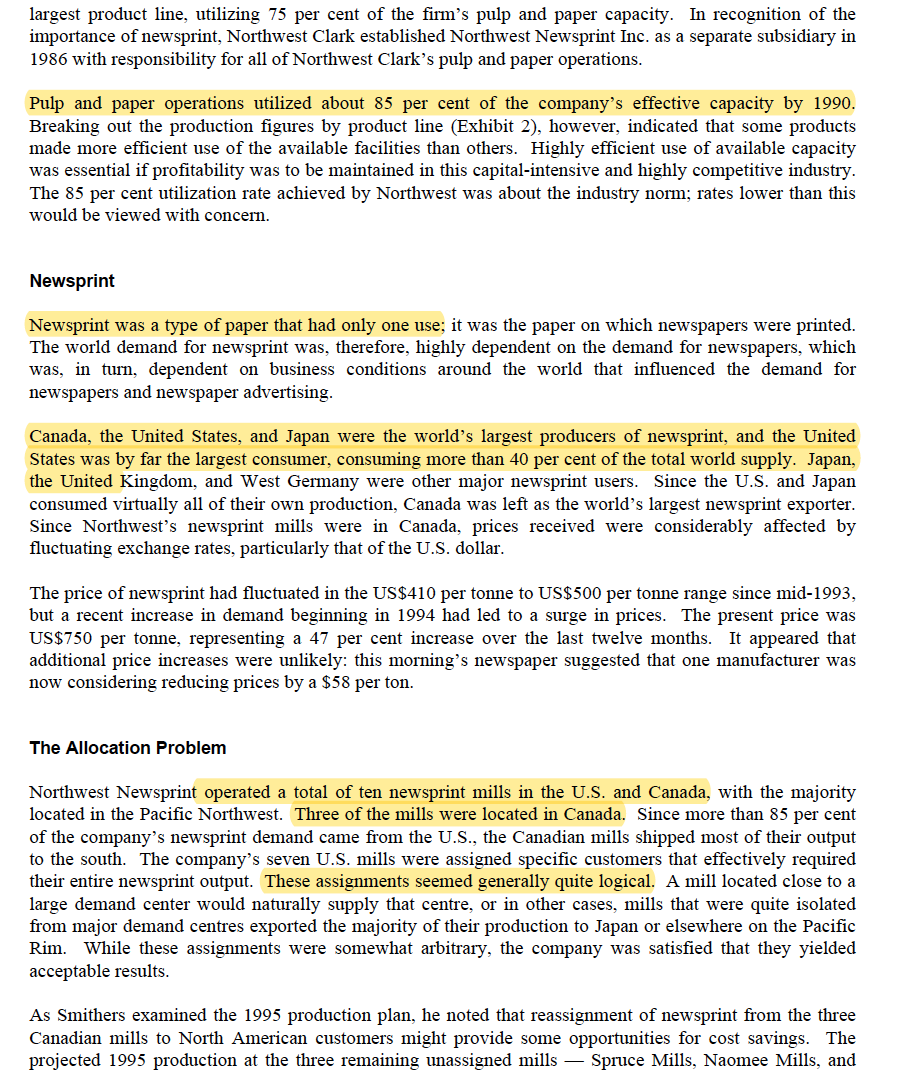
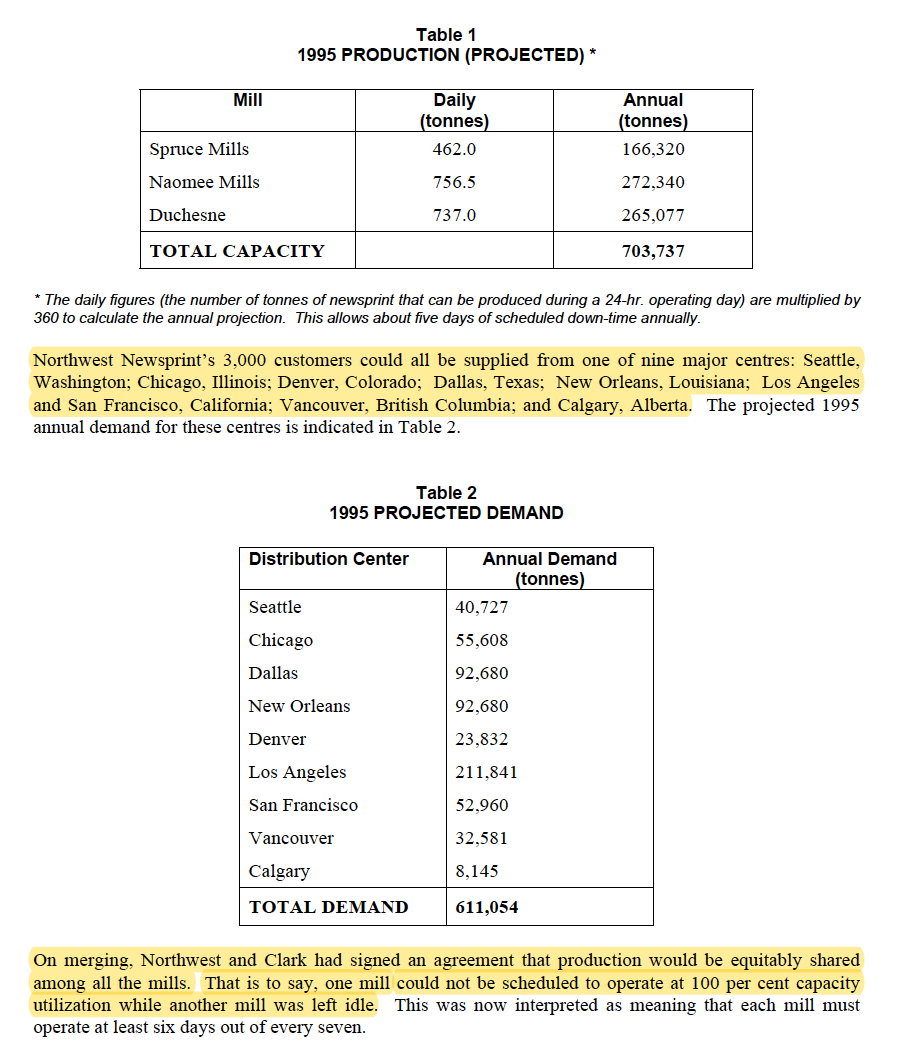
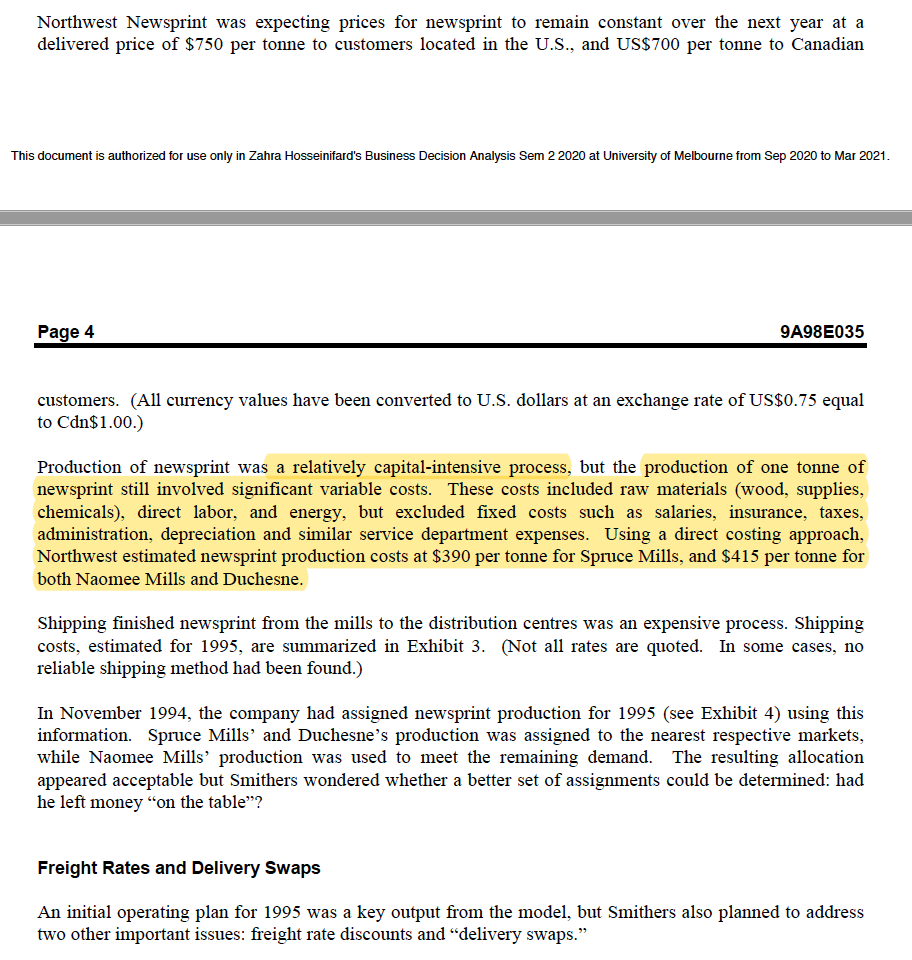
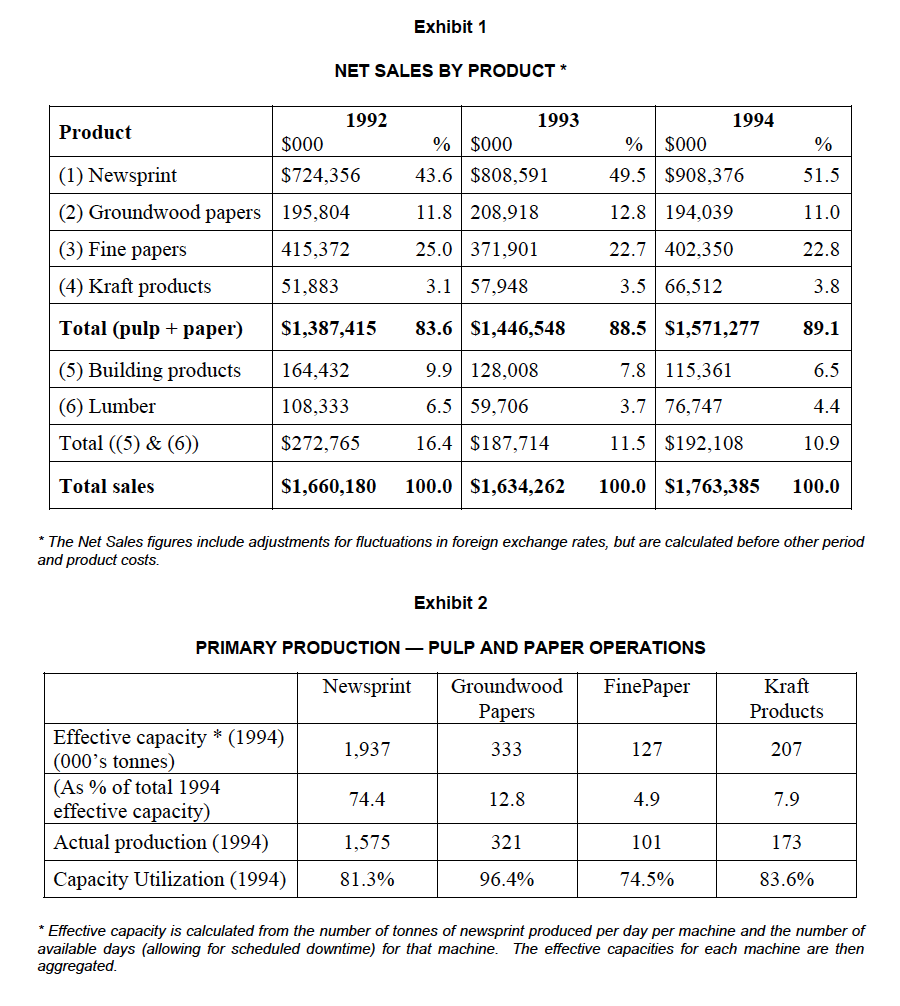
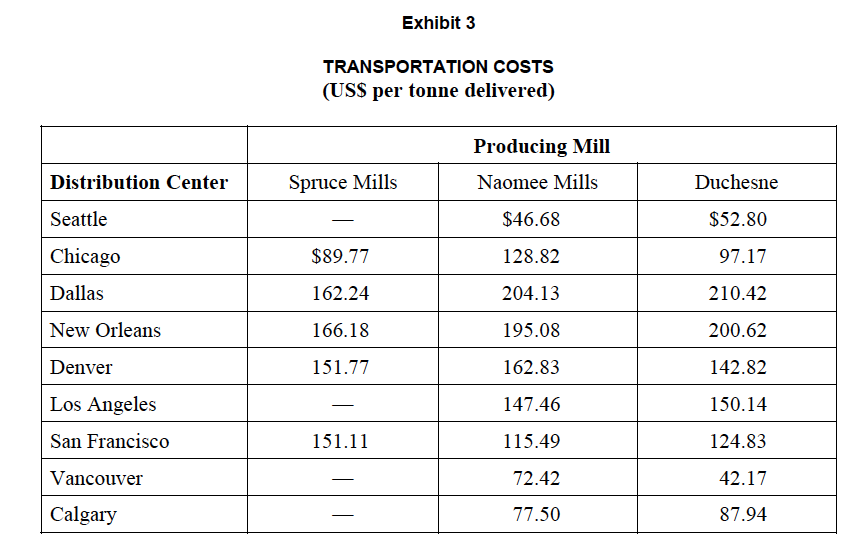
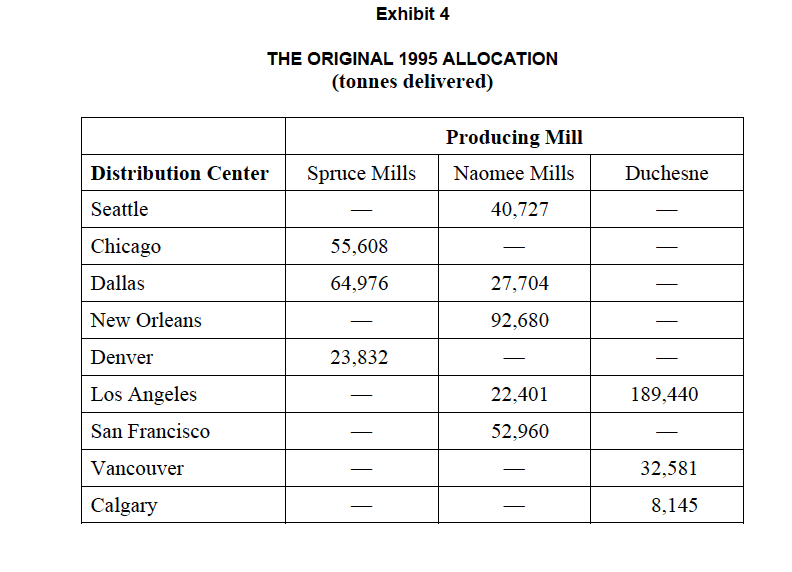
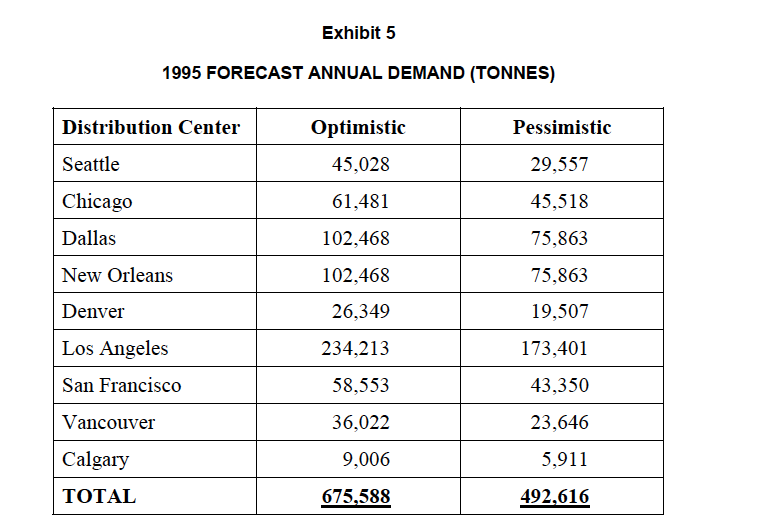
The recent stabilization of the price of newsprint was welcome news for Northwest Newsprint, Inc., and John Smithers was now eager to exploit existing market conditions to the illest. Northwest was a major producer of newsprint with pulpmills in the Pacic Northwest and Canada from which it supplied various North American markets. Smithers, Assistant Controller in Northwest's Core Business-Papers Department, recognized that Northwest's shipping patterns had been formed when market conditions were very di'erent from those today. Reviewing which mill supplied which market would likely reveal some opportunities for cost savings. He initially planned to develop and use a model to investigate the immediate newsprint allocation problem, but he hoped that the model could also be used to address some longer-term \"strategic" issues. NORTHWEST NEWSPRINT'S OPERATIONS [n the late 1980s, the Northwest Forest Products Company of Tacoma, Washington purchased a majority interest in Clark Newsprint Ltd. of British Columbia. By the mid-1980s it had increased its holding in the latter company to almost 100 per cent, and in 1988 the corporate name was changed to Northwest Clark, Inc. Following the acquisition, Northwest Clark Inc. became one of the world's largest producers of newsprint, and ranked as one of the ve largest forest products enterprises, with plants and mills located both in Canada and in the United States. The company also maintained extensive woodlands operations. By 1994 Northwest had sales approaching $2 billion. The company's sales could be broken into six product lines: newsprint, groundwood papers, ne papers, building products, and lumber (see Exhibit 1). Northwest Clark had always been primarily a pulp and paper products producer; however, beginning at the time of the merger, an increasing proportion of the company's total sales were attributable to the lumber and building product lines. Growth in these lines was largely dependent on U.S. housing starts, while newsprint had been, and continued to be, the company's largest product line, utilizing 75 per cent of the rm's pulp and paper capacity. In recognition of the importance of newsprint, Northwest Clark established Northwest Newsprint Inc. as a separate subsidiary in 1986 with responsibility for all of Northwest Clark's pulp and paper operations. Pulp and paper operations utilized about 85 per cent of the company's e'ective capacity by 1990. Breaking out the production gures by product line (Exhibit 2), however, indicated that some products made more efcient use of the available facilities than others. Highly efficient use of available capacity was essential if protability was to be maintained in this capital-intensive and highly competitive industry. The 85 per cent utilization rate achieved by Northwest was about the industry norm; rates lower than this would be viewed with concern. Newsprint Newsprint was a type of paper that had only one use; it was the paper on which newspapers were printed. The world demand for newsprint was, therefore, highly dependent on the demand for newspapers, which was, in turn, dependent on business conditions around the world that inuenced the demand for newspapers and newspaper advertising. Canada, the United States, and Japan were the world's largest producers of newsprint, and the United States was by far the largest consumer, consuming more than 40 per cent of the total world supply. Japan, the United Kingdom, and West Germany were other major newsprint users. Since the U.S. and Japan consumed virtually all of their own production, Canada was le as the world's largest newsprint exporter. Since Northwest's newsprint mills were in Canada, prices received were considerably a'ected by uctuating exchange rates, particularly that of the U.S. dollar. The price of newsprint had uctuated in the US$410 per tonne to US$500 per tonne range since mid-1993, but a recent increase in demand beginning in 1994 had led to a surge in prices. The present price was US$750 per tonne, representing a 47 per cent increase over the last twelve months. It appeared that additional price increases were unlikely: this morning's newspaper suggested that one manufacturer was now considering reducing prices by a $58 per ton. The Allocation Problem Northwest Newsprint operated a total of ten newsprint mills in the U.S. and Canada, with the majority located in the Pacic Northwest. Three of the mills were located in Canada. Since more than 85 per cent of the company's newsprint duand came om the U.S., the Canadian mills shipped most of their output to the south. The company's seven U.S. mills were assigned specic customers that effectively required their entire newsprint output. These assignments seemed generally quite logical. A mill located close to a large demand center would naturally supply that centre, or in other cases, mills that were quite isolated from major demand centres exported the majority of their production to Japan or elsewhere on the Pacic Rim. While these assignments were somewhat arbitrary, the company was satised that they yielded acceptable results. As Smithers examined the 1995 production plan, he noted that reassignment of newsprint om the three Canadian mills to North American customers might provide some opportunities for cost savings. The projected 1995 production at the three remaining unassigned mills Spruce Mills, Naomee Mills, and Table 1 1995 PRODUCTION (PROJECTED) * Mill Daily Annual (tonnes) (tonnes) Spruce Mills 462.0 166,320 Naomee Mills 756.5 272,340 Duchesne 737.0 265,077 TOTAL CAPACITY 703,737 * The daily figures (the number of tonnes of newsprint that can be produced during a 24-hr. operating day) are multiplied by 360 to calculate the annual projection. This allows about five days of scheduled down-time annually. Northwest Newsprint's 3,000 customers could all be supplied from one of nine major centres: Seattle, Washington; Chicago, Illinois; Denver, Colorado; Dallas, Texas; New Orleans, Louisiana; Los Angeles and San Francisco, California; Vancouver, British Columbia; and Calgary, Alberta. The projected 1995 annual demand for these centres is indicated in Table 2. Table 2 1995 PROJECTED DEMAND Distribution Center Annual Demand (tonnes) Seattle 40,727 Chicago 55,608 Dallas 92,680 New Orleans 92.680 Denver 23,832 Los Angeles 211,841 San Francisco 52,960 Vancouver 32,581 Calgary 8,145 TOTAL DEMAND 611,054 On merging, Northwest and Clark had signed an agreement that production would be equitably shared among all the mills. That is to say, one mill could not be scheduled to operate at 100 per cent capacity utilization while another mill was left idle. This was now interpreted as meaning that each mill must operate at least six days out of every seven.Northwest Newsprint was expecting prices for newsprint to remain constant over the next year at a delivered price of $750 per tonne to customers located in the U.S., and US$700 per tonne to Canadian This document is autllozed tor use only in Zahla Hosseiniiard's Bushess Decision Analysis Sem 2 2021] at University of Meboume irorn Sep 2020 to Mar 2021. Page 4 9A98 E035 customers. (All currency values have been converted to U.S. dollars at an exchange rate of US$0.75 equal to Cdn$l .00.) Production of newsprint was a relatively capital-intensive process, but the production of one tonne of newsprint still involved signicant variable costs. These costs included raw materials (wood, supplies, chemicals), direct labor, and energy, but excluded xed costs such as salaries, insurance, taxes, administration, depreciation and similar service department expenses. Using a direct costing approach, Northwest estimated newsprint production costs at $390 per tonne for Spruce Mills, and $415 per tonne for both Naomee Mills and Duchesne. Shipping nished newsprint from the mills to the distribution centres was an expensive process. Shipping costs, estimated for 1995, are summarized in Exhibit 3. (Not all rates are quoted. In some cases, no reliable shipping method had been found.) In November 1994, the company had assigned newsprint production for 1995 (see Exhibit 4) using this information. Spruce Mills' and Duchesne's production was assigned to the nearest respective markets, while Naomee Mills' production was used to meet the remaining demand. The resulting allocation appeared acceptable but Smithers wondered whether a better set of assignments could be determined: had he le money \"on the table"? Freight Rates and Delivery Swaps An initial operating plan for 1995 was a key output from the model, but Smithers also planned to address two other important issues: freight rate discounts and \"delivery swaps.\" Freight Rate Discounts were common for large volumes and in the past Northwest had managed to negotiate such discounts with most carriers when volumes were sufcient. Smithers believed that he could negotiate a freight rate reduction of about ve per cent in 1995 for any mill-todestination shipments greater than 100,000 tonnes. He wondered whether the availability of such discounts would affect the operating plan and the projected prot. \"Delivery Swaps\" were under negotiation between Northwest Newsprint and some of its major customers, including the Los Angeles Times, Knight-Kidder and Hearst chains. \"Delivery swaps\" traded o' customers to other newsprint suppliers in order to reduce eight costs. Under a swap arrangement, Northwest's contract to supply customer A would actually be delivered by another newsprint supplier, most likely one of Northwest's US mills, which could meet the contract at lower cost. Usually the alternate supplier was a mill which was closer to customer A than Northwest's Canadian mill and, consequently, had lower freight costs. Smithers hoped to use the model to identify the centre(s) that would make the proposed delively swaps cost-attractive. Longer-Tenn Issues Northwest Newsprint's management recognized that the model could be useil for addressing some capacity planning issues. The operating plan projected 1995 capacity utilization for newsprint production of about 86 per cent. Some major capital decisions under consideration could, however, dramatically alter the availability of newsprint capacity. This document is aulon'zed tot use only in Zahla Hosseinitaid's Business Decision Analysis Sam 2 2020 at Univelsity of Mebourne trorn Sep 2020 to Mar 2021. Page 5 9A98E035 Alternative 1 involved the conversion of a newsprint machine at Naomee Mills to groundwood specialties' production. Groundwood specialties were types of paper used for printing advertising inserts, telephone directories, and computer forms, and this was a faster-growing segment of the printed paper business than was newsprint. In 1994, the groundwood speciality business had operated at 96 per cent of effective capacity, leading to concern that customers for these products might have to be turned away in the future if additional production capacity was not made available. Converting one newsprint machine at Naomee Nlls would shift 58,000 tonnes per year of paper-making capacity om newsprint to golmdwood specialties at minimal cost. Alternative 2 was to reduce newsprint capacity by selling 011 an older machine located at Naomee Mills, reducing capacity by 44,000 tonnes per year (it was unlikely that the company would make much money on the sale of this equipment). As an alternative to selling this second machine, it could be converted to youndwood specialties production, along with the rst, at minimal cost. Alternative 3 was to expand existing capacity. A new newsprint machine with a capacity of 150,000 tonnes of newsprint per year could be installed at any of the three mills for a total cost of $120 million. The new machines produced paper of a higher quality than that obtained from most of the existing, older machines. Higher quality newsprint was emerging as a major competitive factor within the industry. In the early 1990s when there had been worldwide oversupply of newsprint, customers had been demanding a higher quality product from suppliers. As the market had picked up, these demands had faded somewhat, but as new capacity came on line and production expanded, it seemed clear that this trend would reappear. In order to respond to this demand for higher quality, Northwest could install completely new equipment (as mentioned above), or could upgrade existing machinery. Older equipment could be reengineered to deliver a higher quality product (comparable to newsprint from the new machine) for an expenditure of about $8 million per machine. However, it was not clear to Smithers how the availability of higher quality newsprint would affect sales. Alternative 4 was to construct a new mill in Jasper, Georgia. This new operation would cost at least $250 million, and would include woodlot operations, pulping facilities, a complete newsprint mill, controls and administrative facilities. In addition, new newsprint machinery, similar to that mentioned in alternative 3, would also have to be purchased at additional cost. A signicant advantage of such expansion would be a dramatic reduction in the cost of deliveiy to Northwest's southern US. customers. Demand Forecasts Smithers believed that the original 1995 demand forecasts were both reasonable and realistic but he wished to explore the options available to Northwest under more optimistic and under more pessimistic (Exhibit 5) demand projections. He was particularly concerned about which strategic alternatives should be considered under the di'ering demand conditions. Northwest Newsprint was running its newsprint operation using existing capacity and the assignment plan developed late in 1994. Smithers hoped to use the information he had collected to investigate alternate allocation plans, as well as to examine some of the strategic options facing Northwest. Exhibit 1 NET SALES BY PRODUCT * Product 1992 1993 1994 $000 $000 $000 0/ (1) Newsprint $724,356 43.6 $808,591 19.5 $908,376 51.5 (2) Groundwood papers 195,804 11.8 208,918 12.8 194.039 11.0 (3) Fine papers 415,372 25.0 371,901 22.7 402,350 22.8 (4) Kraft products 51.883 3.1 57,948 3.5 66,512 3.8 Total (pulp + paper) $1,387,415 83.6 $1,446,548 88.5 $1,571,277 89.1 (5) Building products 164,432 9.9 128,008 7.8 115,361 6.5 (6) Lumber 108,333 6.5 59,706 3.7 76,747 4.4 Total ((5) & (6)) $272,765 16.4 $187,714 11.5 $192,108 10.9 Total sales $1,660,180 100.0 $1,634,262 100.0 $1,763,385 100.0 * The Net Sales figures include adjustments for fluctuations in foreign exchange rates, but are calculated before other period and product costs. Exhibit 2 PRIMARY PRODUCTION - PULP AND PAPER OPERATIONS Newsprint Groundwood FinePaper Kraft Papers Products Effective capacity * (1994) (000's tonnes) 1,937 333 127 207 (As % of total 1994 effective capacity) 74.4 12.8 4.9 7.9 Actual production (1994) 1,575 321 101 173 Capacity Utilization (1994) 81.3% 96.4% 74.5% 83.6% * Effective capacity is calculated from the number of tonnes of newsprint produced per day per machine and the number of available days (allowing for scheduled downtime) for that machine. The effective capacities for each machine are then aggregated.Exhibit 3 TRANSPORTATION COSTS (USS per tonne delivered) Producing Mill Distribution Center Spruce Mills Naomee Mills Duchesne Seattle $46.68 $52.80 Chicago $89.77 128.82 97.17 Dallas 162.24 204.13 210.42 New Orleans 166.18 195.08 200.62 Denver 151.77 162.83 142.82 Los Angeles 147.46 150.14 San Francisco 151.11 115.49 124.83 Vancouver 72.42 42.17 Calgary 77.50 87.94Exhibit 4 THE ORIGINAL 1995 ALLOCATION (tonnes delivered) Producing Mill Distribution Center Spruce Mills Naomee Mills Duchesne Seattle 40.727 Chicago 55,608 Dallas 64,976 27,704 New Orleans 92.680 Denver 23,832 Los Angeles 22.401 189.440 San Francisco 52,960 Vancouver 32,581 Calgary 8,145Exhibit 5 1995 FORECAST ANNUAL DEMAND (TONNES) Distribution Center Optimistic Pessimistic Seattle 45.028 29,557 Chicago 61.481 45,518 Dallas 102,468 75,863 New Orleans 102.468 75,863 Denver 26.349 19,507 Los Angeles 234.213 173,401 San Francisco 58.553 43,350 Vancouver 36.022 23,646 Calgary 9.006 5,911 TOTAL 675,588 492,616