Answered step by step
Verified Expert Solution
Link Copied!

Question

1 Approved Answer

1. Describe the variable studied in the survey 2. Is this variable categorical (qualitative) or numerical (quantitative)3. Calculate the 95% confidence interval for the proportion

1. Describe the variable studied in the survey 2. Is this variable categorical (qualitative) or numerical (quantitative)3. Calculate the 95% confidence interval for the proportion of all US adults who think life imprisonment is the better penalty for murder. Show all work4. Calculate the 95% confidence interval for the proportion of all US adults who think the death penalty is the better penalty for murder. Show all work5. Based upon the two confidence intervals you found above (in 4 and 5), could the population proportion of all US adults who think life imprisonment is the better penalty for murder be equal to the population proportion of all US adults who think the death penalty is the better penalty for murder? Explain why or why not
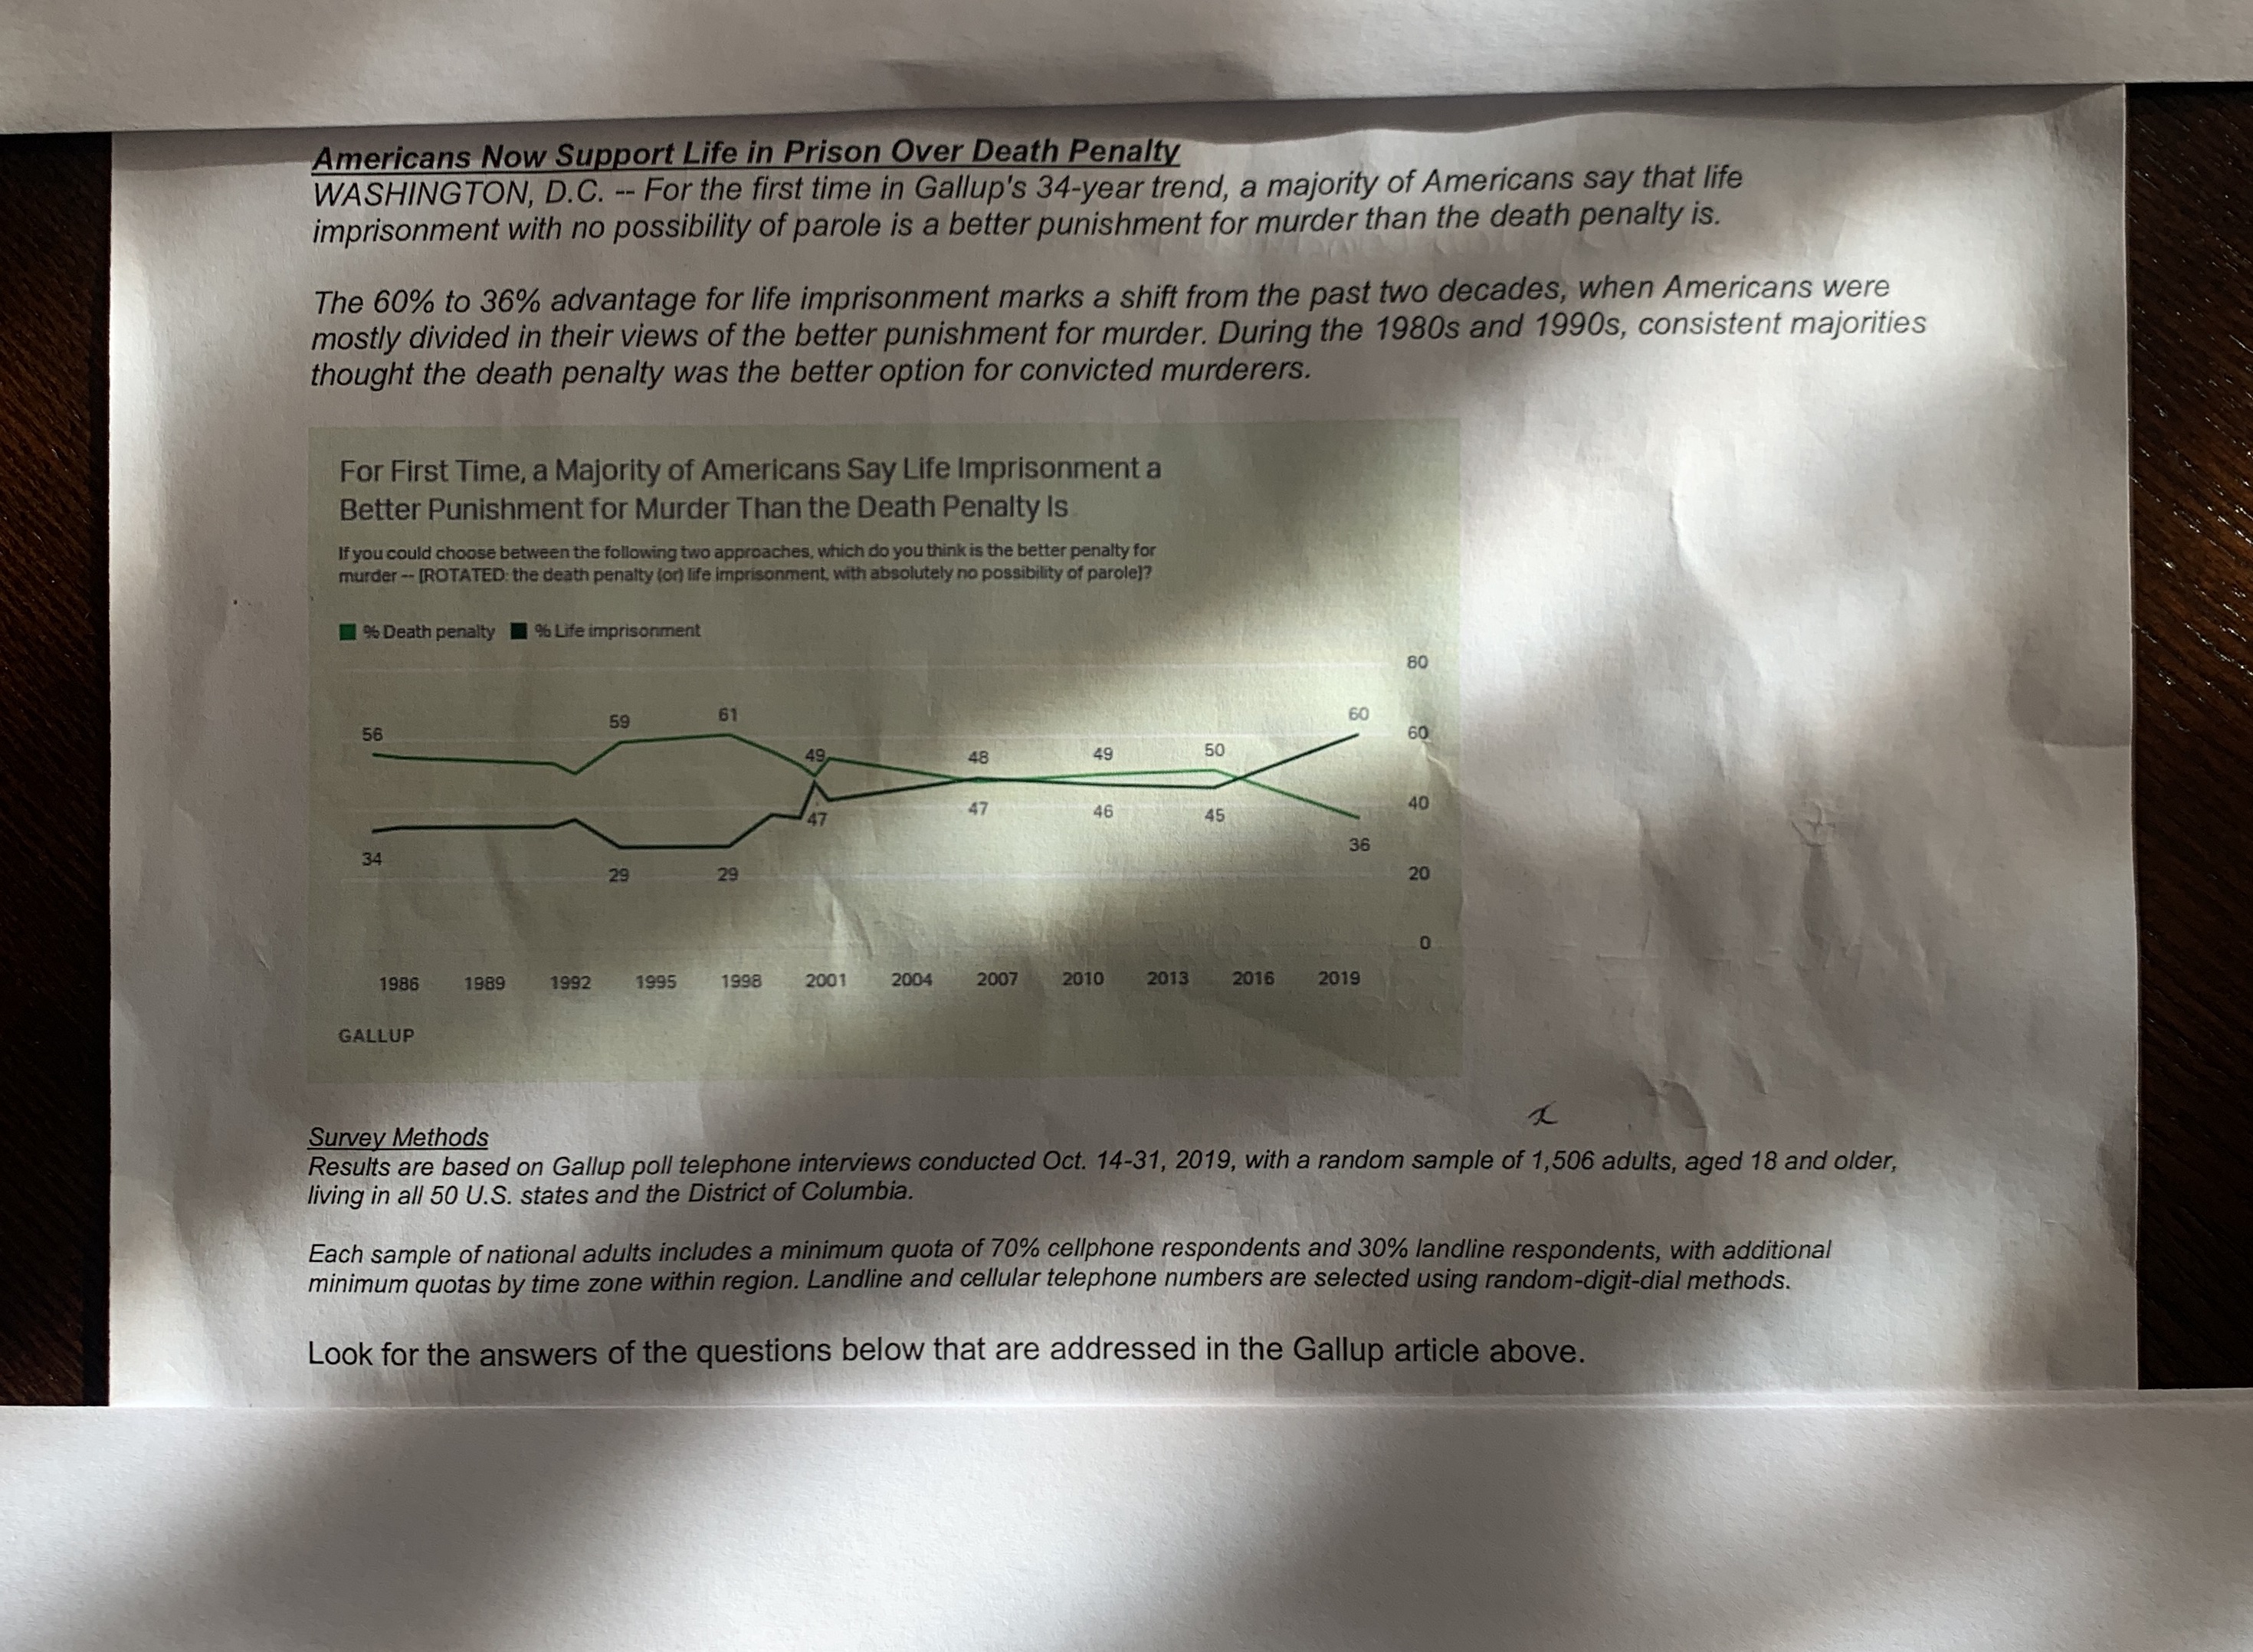
image text in transcribed
Americans Now Support Life in Prison Over Death Penalty WASHINGTON, D.C. -- For the first time in Gallup's 34-year trend, a majority of Americans say that life imprisonment with no possibility of parole is a better punishment for murder than the death penalty is. The 60% to 36% advantage for life imprisonment marks a shift from the past two decades, when Americans were mostly divided in their views of the better punishment for murder. During the 1980s and 1990s, consistent majorities thought the death penalty was the better option for convicted murderers. For First Time, a Majority of Americans Say Life Imprisonment a Better Punishment for Murder Than the Death Penalty Is If you could choose between the following two approaches, which do you think is the better penalty for murder - [ROTATED: the death penalty (or) life imprisonment, with absolutely no possibility of parole]? % Death penalty | % Life imprisonment 80 61 56 60 60 49 48 49 50 47 47 46 $5 40 34 36 29 29 20 0 1986 1989 1992 1995 1998 2001 2004 2007 2010 2013 2016 2019 GALLUP Survey Methods Results are based on Gallup poll telephone interviews conducted Oct. 14-31, 2019, with a random sample of 1,506 adults, aged 18 and older, living in all 50 U.S. states and the District of Columbia. Each sample of national adults includes a minimum quota of 70% cellphone respondents and 30% landline respondents, with additional minimum quotas by time zone within region. Landline and cellular telephone numbers are selected using random-digit-dial methods. Look for the answers of the questions below that are addressed in the Gallup article above

Step by Step Solution

There are 3 Steps involved in it

Step: 1

blur-text-image

Get Instant Access to Expert-Tailored Solutions

See step-by-step solutions with expert insights and AI powered tools for academic success

Step: 2

blur-text-image

Step: 3

blur-text-image

Ace Your Homework with AI

Get the answers you need in no time with our AI-driven, step-by-step assistance

Get Started

Recommended Textbook for

College Algebra

Authors: Robert F Blitzer

7th Edition

013449492X, 9780134453262

More Books

Students also viewed these Mathematics questions