

Question
1. Describe when each of the following would happen: a. Supply curve gets flatter: b. Supply curve gets steeper: 2. Fill in the chart with
1. Describe when each of the following would happen:
a. Supply curve gets flatter:
b. Supply curve gets steeper:
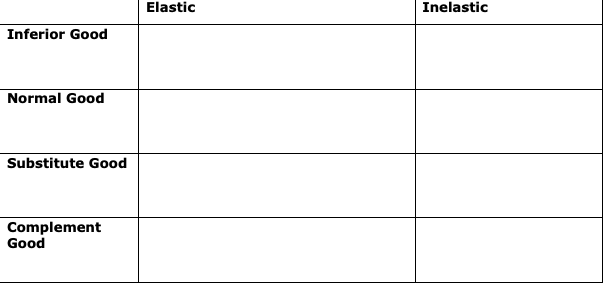
2. Fill in the chart with the range values for the elasticity of each type of good.
Step by Step Solution
There are 3 Steps involved in it
Step: 1

Get Instant Access to Expert-Tailored Solutions
See step-by-step solutions with expert insights and AI powered tools for academic success
Step: 2

Step: 3
Ace Your Homework with AI
Get the answers you need in no time with our AI-driven, step-by-step assistance
Get Started
International economics
Authors: Robert J. Carbaugh
13th Edition
978-1439038949, 1439038945, 978-8131518823