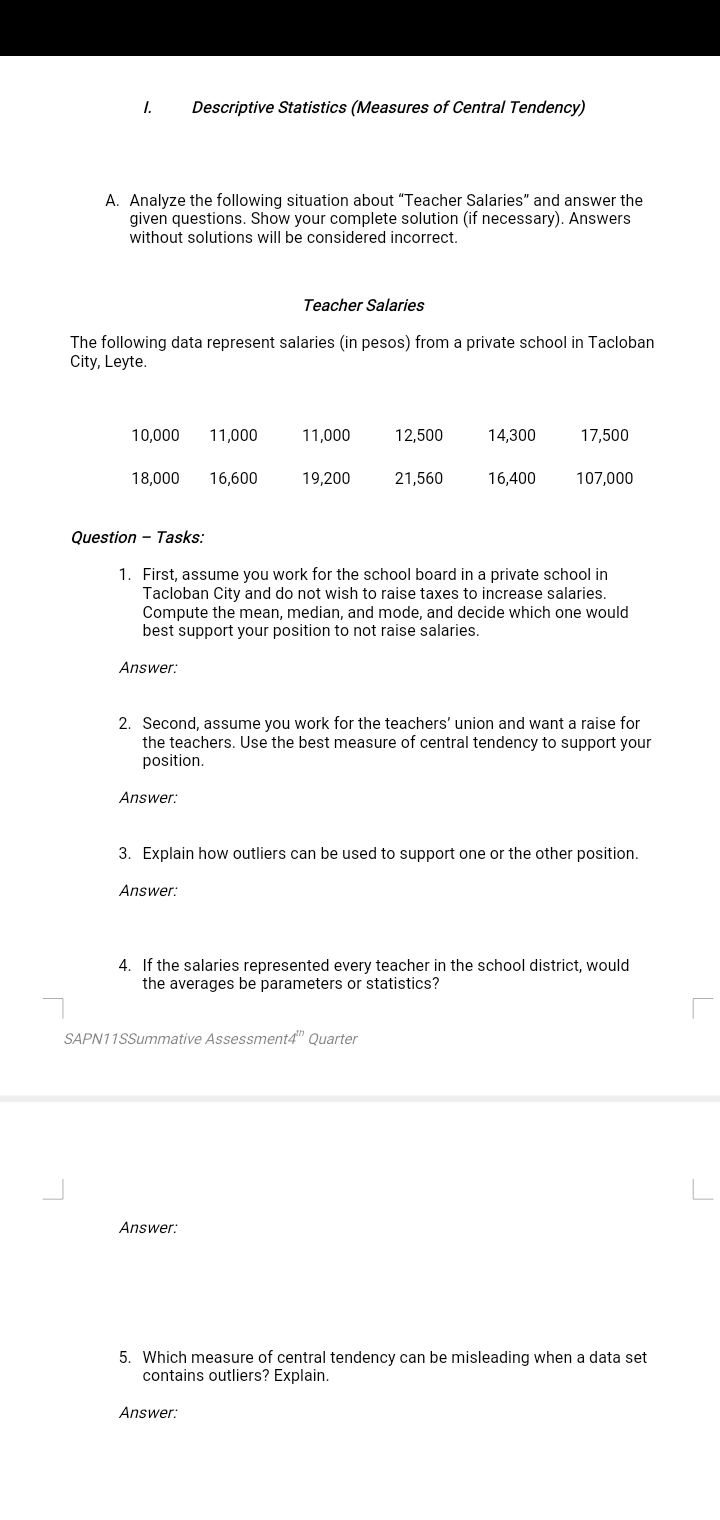
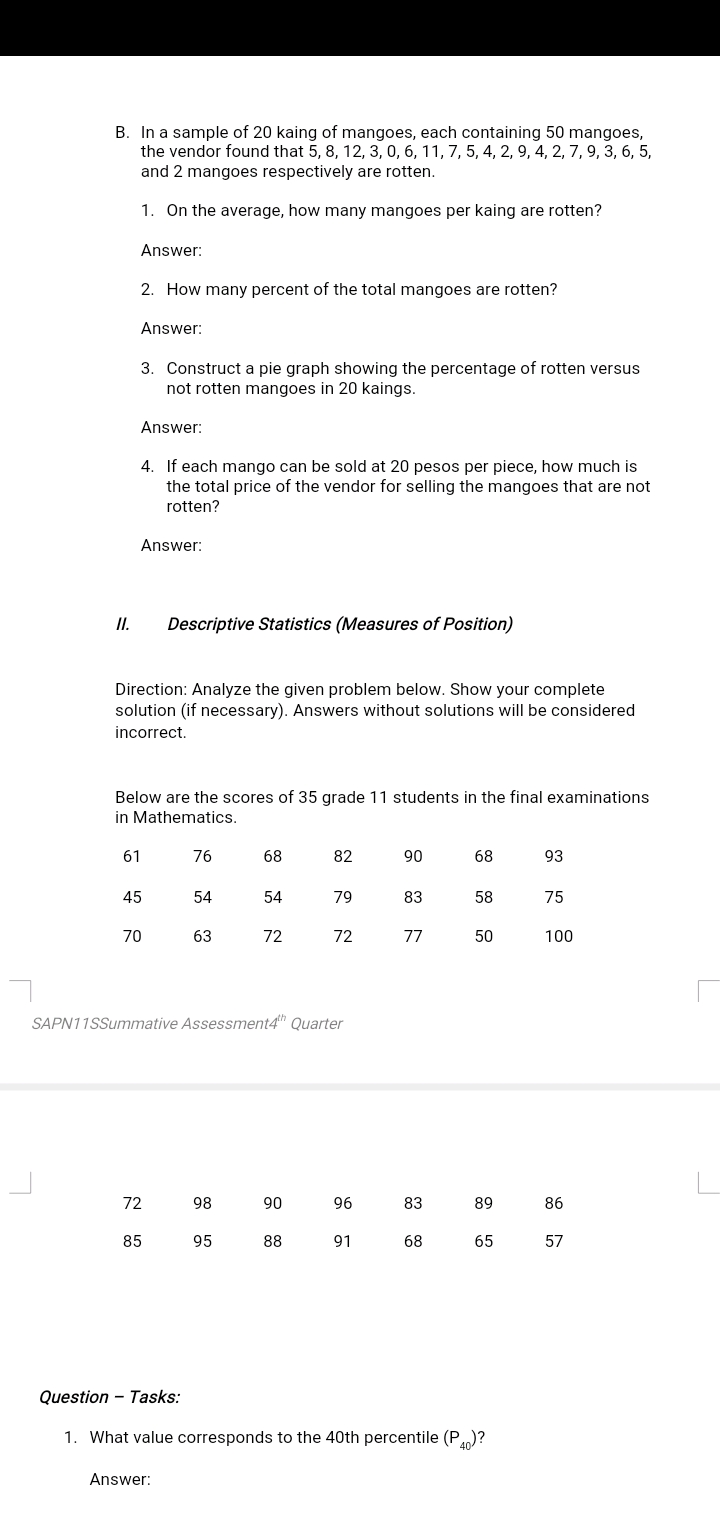
1. Descriptive Statistics (Measures of Can trai Tendency) A. Analyze the following situation about "Teacher Salaries" and answer the given questions. Show your complete solution [if necessary). Answers without solutions will be considered incorrect. Teacher Saiaries The following data represent salaries (in pesos) from a private school in Tacloban City. Leyte. 10.000 11.000 11.000 12.500 14.300 17.500 1 8.000 1 6.600 1 9.200 21.560 15.400 1 07.000 Question - Tasks: 1. First. assume you work for the school board in a private school in Tacloban City and do not wish to raise taxes to increase salaries. Compute the mean. median. and mode. and decide which one would best support your position to not raise salaries. Answer: 2. Second. assume you work for the teachers' union and want a raise for the teachers. Use the best measure of central tendency to support your position. Answer: 3. Explain how outliers can be used to support one or the other position. Answer: 4. If the salaries represented every teacher in the school district, would the averages be parameters or statistics? SAPN? iSSummari've Assessment/2" Quarter Answer: 5. Which measure of central tendency can be misleading when a data set contains outliers? Explain. Answer: B. In a sample of 20 kaing of mangoes, each containing 50 mangoes, the vendor found that 5, 8, 12, 3, 0. 6, 11.7, 5. 4. 2, 9, 4. 2. 7, 9. 3. 6. 5, and 2 mangoes respectively are rotten. 1, On the average, how many mangoes per kaing are rotten? Answer: 2. How many percent of the total mangoes are rotten? Answer: 3. Construct a pie graph showing the percentage of rotten versus not rotten mangoes in 20 kaings. Answer: 4. If each mango can be sold at 20 pesos per piece, how much is the total price of the vendor for selling the mangoes that are not rotten? Answer: ii. Descriptive Statistics (Measures of Position) Direction: Analyze the given problem below. Show your complete 3 olution {if necessary). Answers without solutions will be considered incorrect. Below are the scores of 35 grade 11 students in the final examinations in Mathematics. 7 6'1 76 68 82 90 68 93 45 54 54 79 83 58 75 70 63 72 72 77 50 100 3A PM 1 FS'SummatiI/e A ssessmen 2'4\"" Quarter 72 98 90 9 6 83 89 86 85 95 88 91 68 65 57 Question - Tasks: 1. What value corresponds to the 40th percentile (P40)


