Answered step by step
Verified Expert Solution
Question
1 Approved Answer
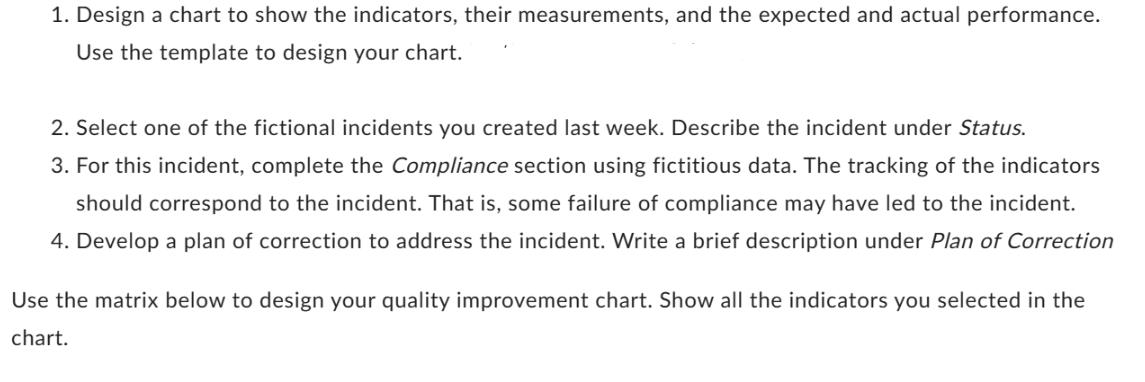
1. Design a chart to show the indicators, their measurements, and the expected and actual performance. Use the template to design your chart. 2.


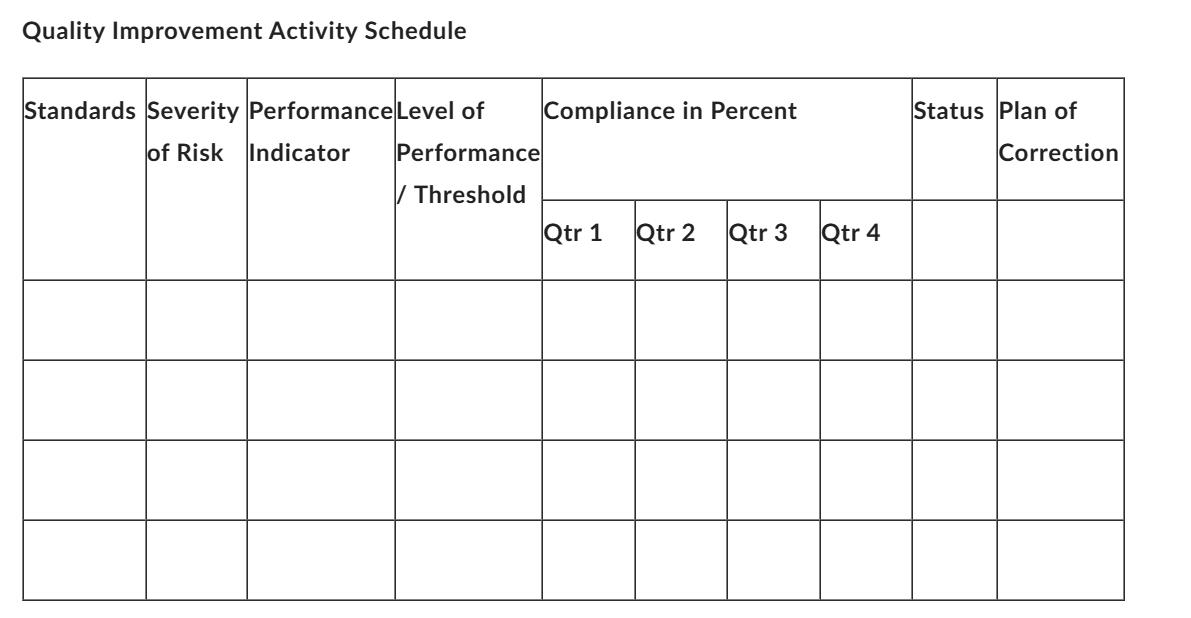
1. Design a chart to show the indicators, their measurements, and the expected and actual performance. Use the template to design your chart. 2. Select one of the fictional incidents you created last week. Describe the incident under Status. 3. For this incident, complete the Compliance section using fictitious data. The tracking of the indicators should correspond to the incident. That is, some failure of compliance may have led to the incident. 4. Develop a plan of correction to address the incident. Write a brief description under Plan of Correction Use the matrix below to design your quality improvement chart. Show all the indicators you selected in the chart. Quality Improvement Activity Schedule Standards Severity Performance Level of of Risk Indicator Performance / Threshold Compliance in Percent Qtr 1 Qtr 2 Qtr 3 Qtr 4 Status Plan of Correction
Step by Step Solution
★★★★★
3.45 Rating (155 Votes )
There are 3 Steps involved in it
Step: 1
Heres a template for your quality improvement chart Indicator Measurement Expec...
Get Instant Access to Expert-Tailored Solutions
See step-by-step solutions with expert insights and AI powered tools for academic success
Step: 2

Step: 3

Ace Your Homework with AI
Get the answers you need in no time with our AI-driven, step-by-step assistance
Get Started


