

Question
1. Determine a sale value for the property in year 5 based on the appropriate terminal cap rate from Exhibit 8 and projected NOI. To
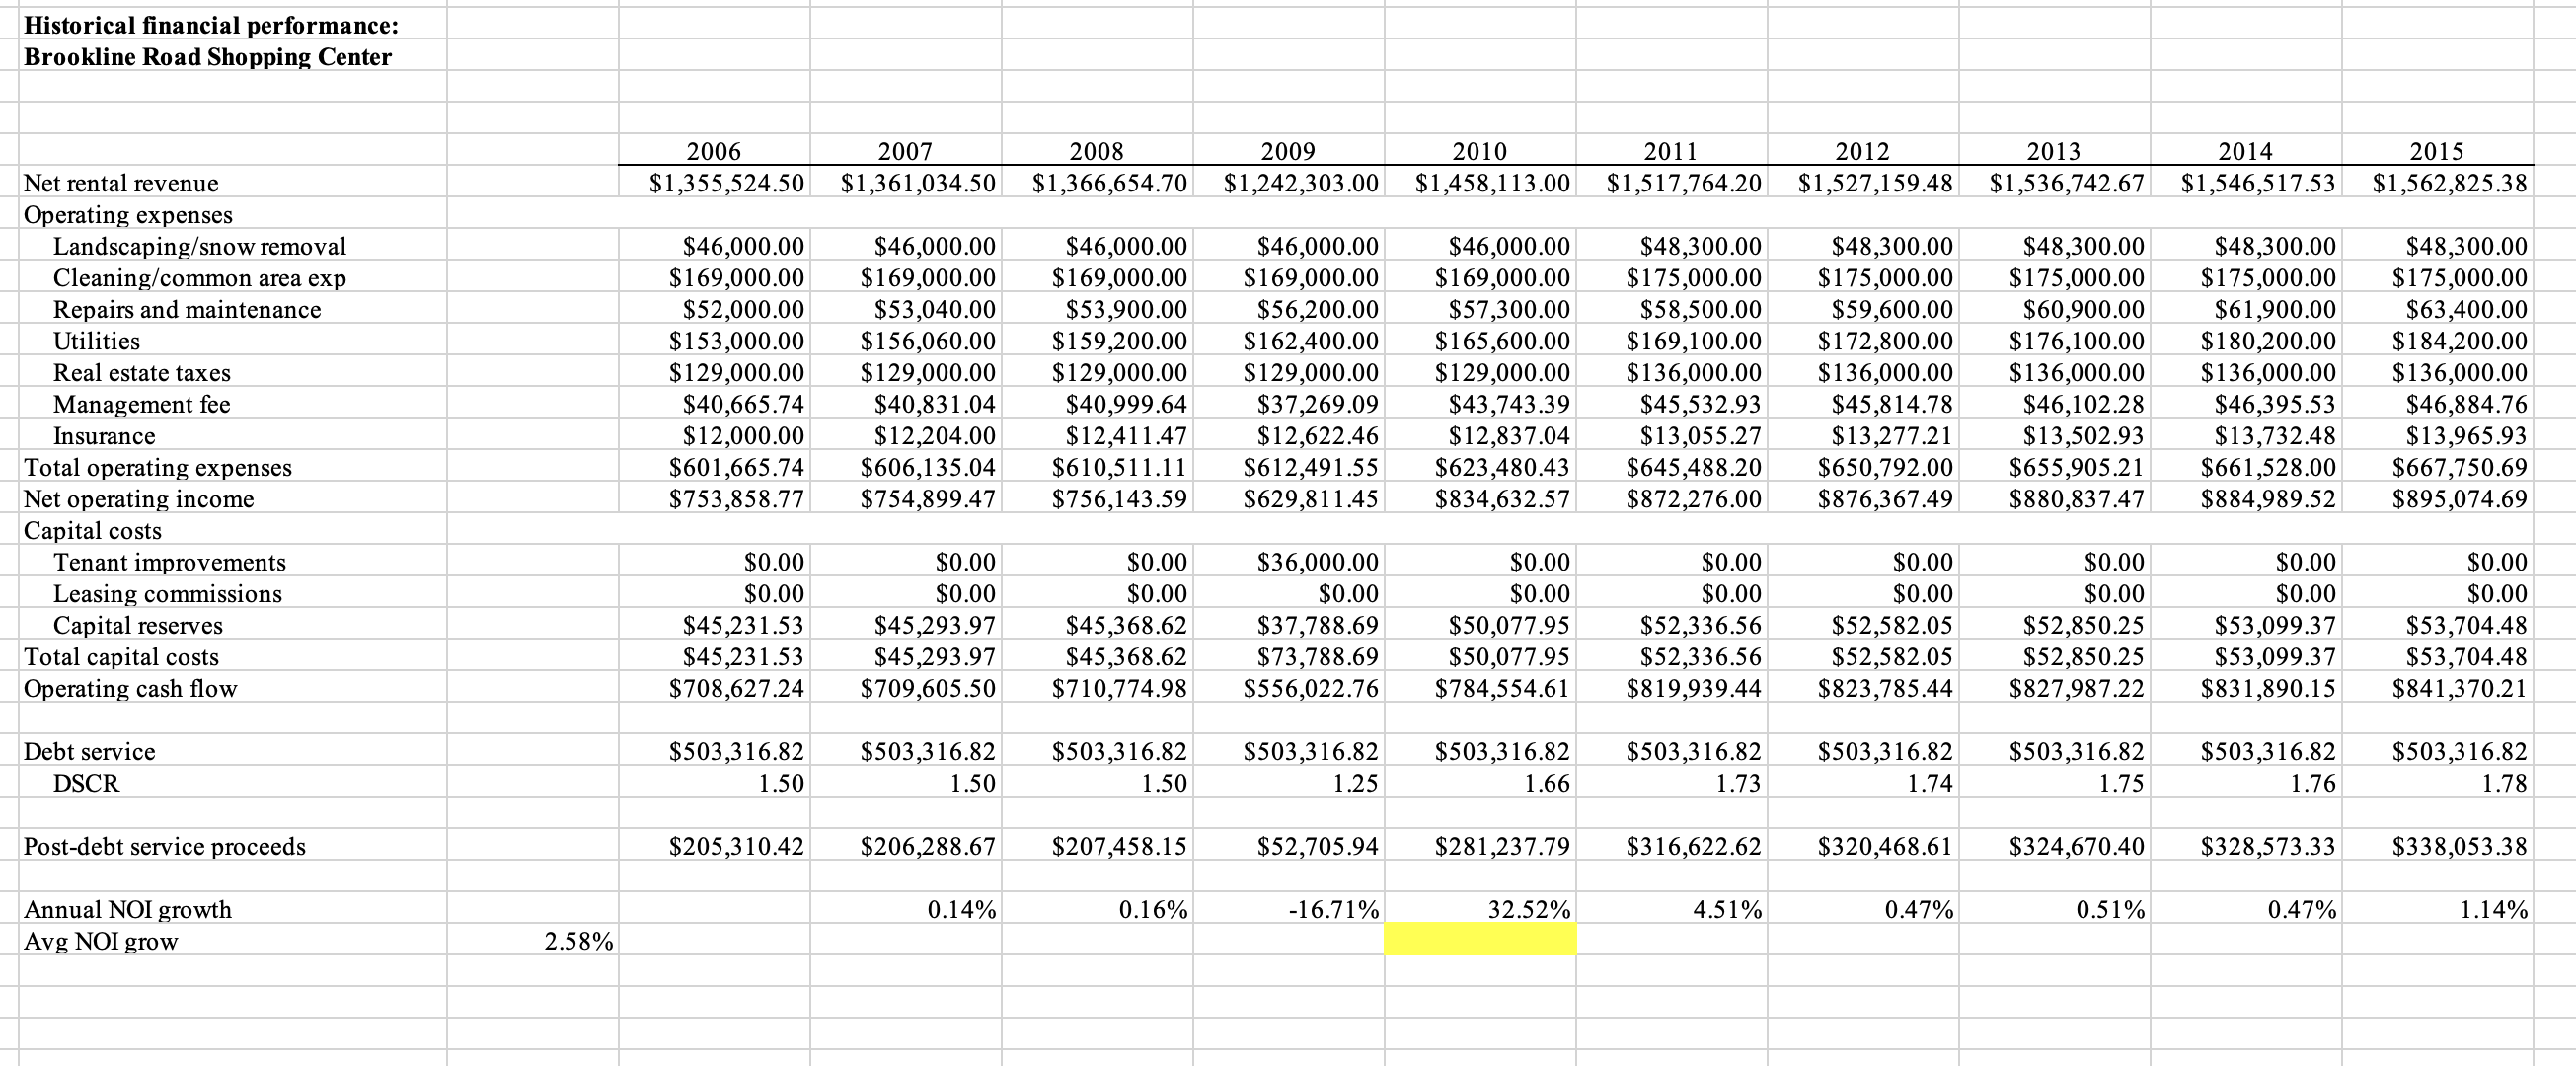
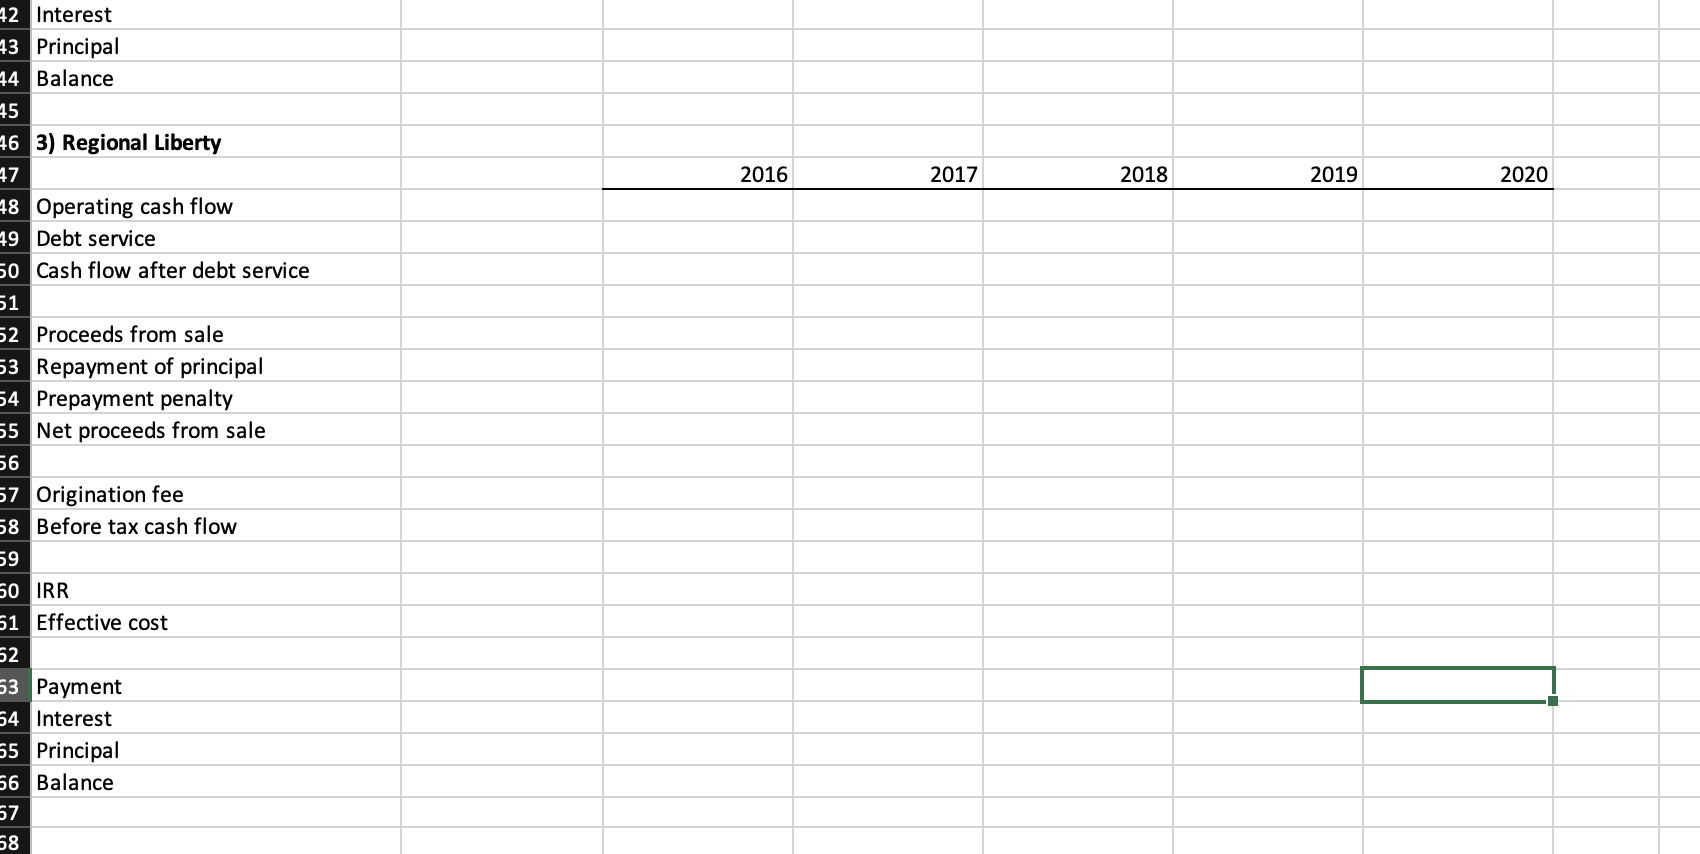
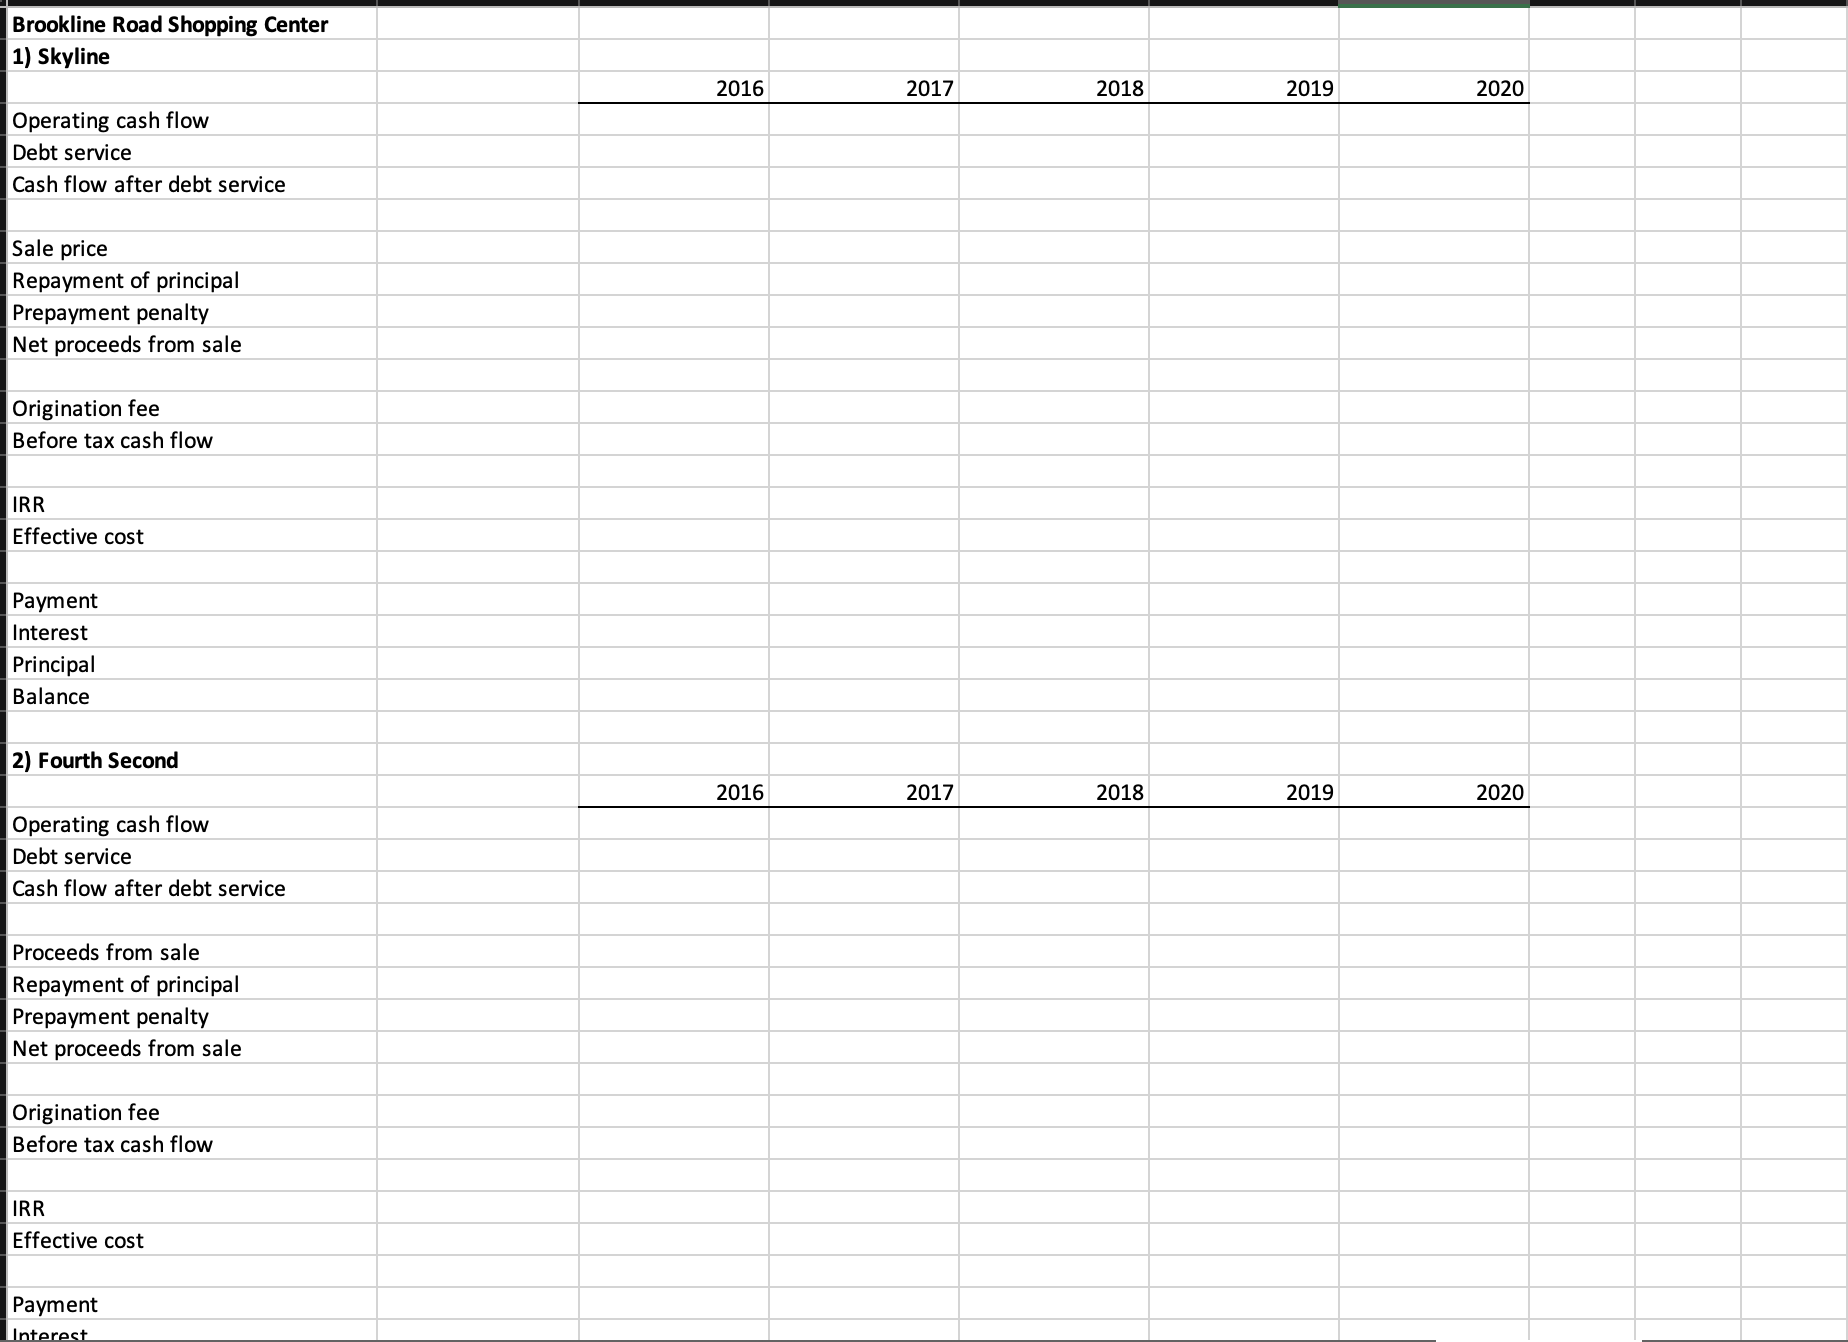
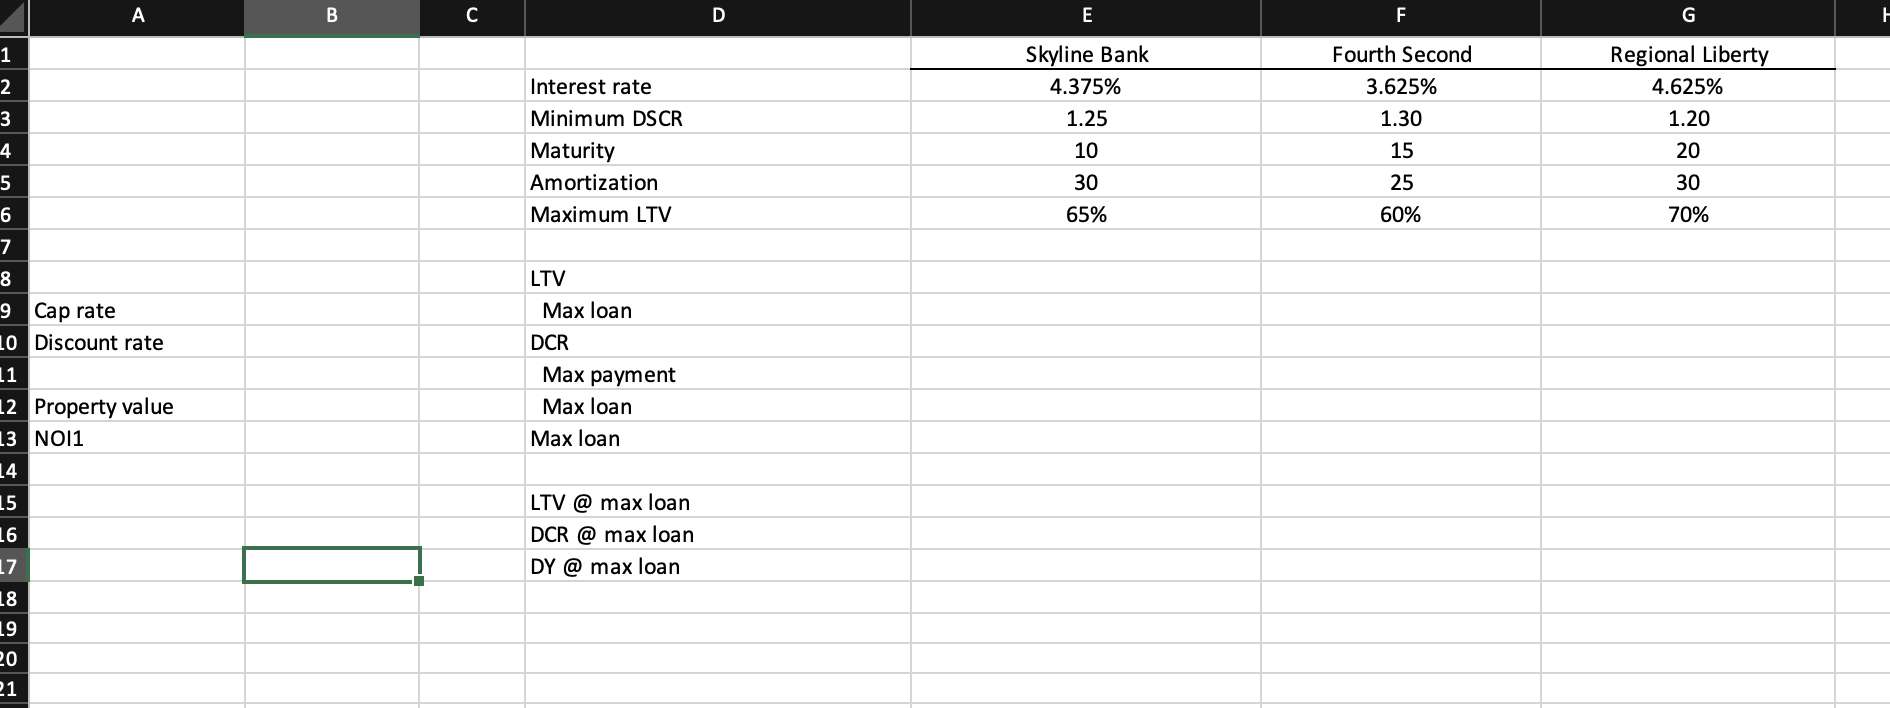
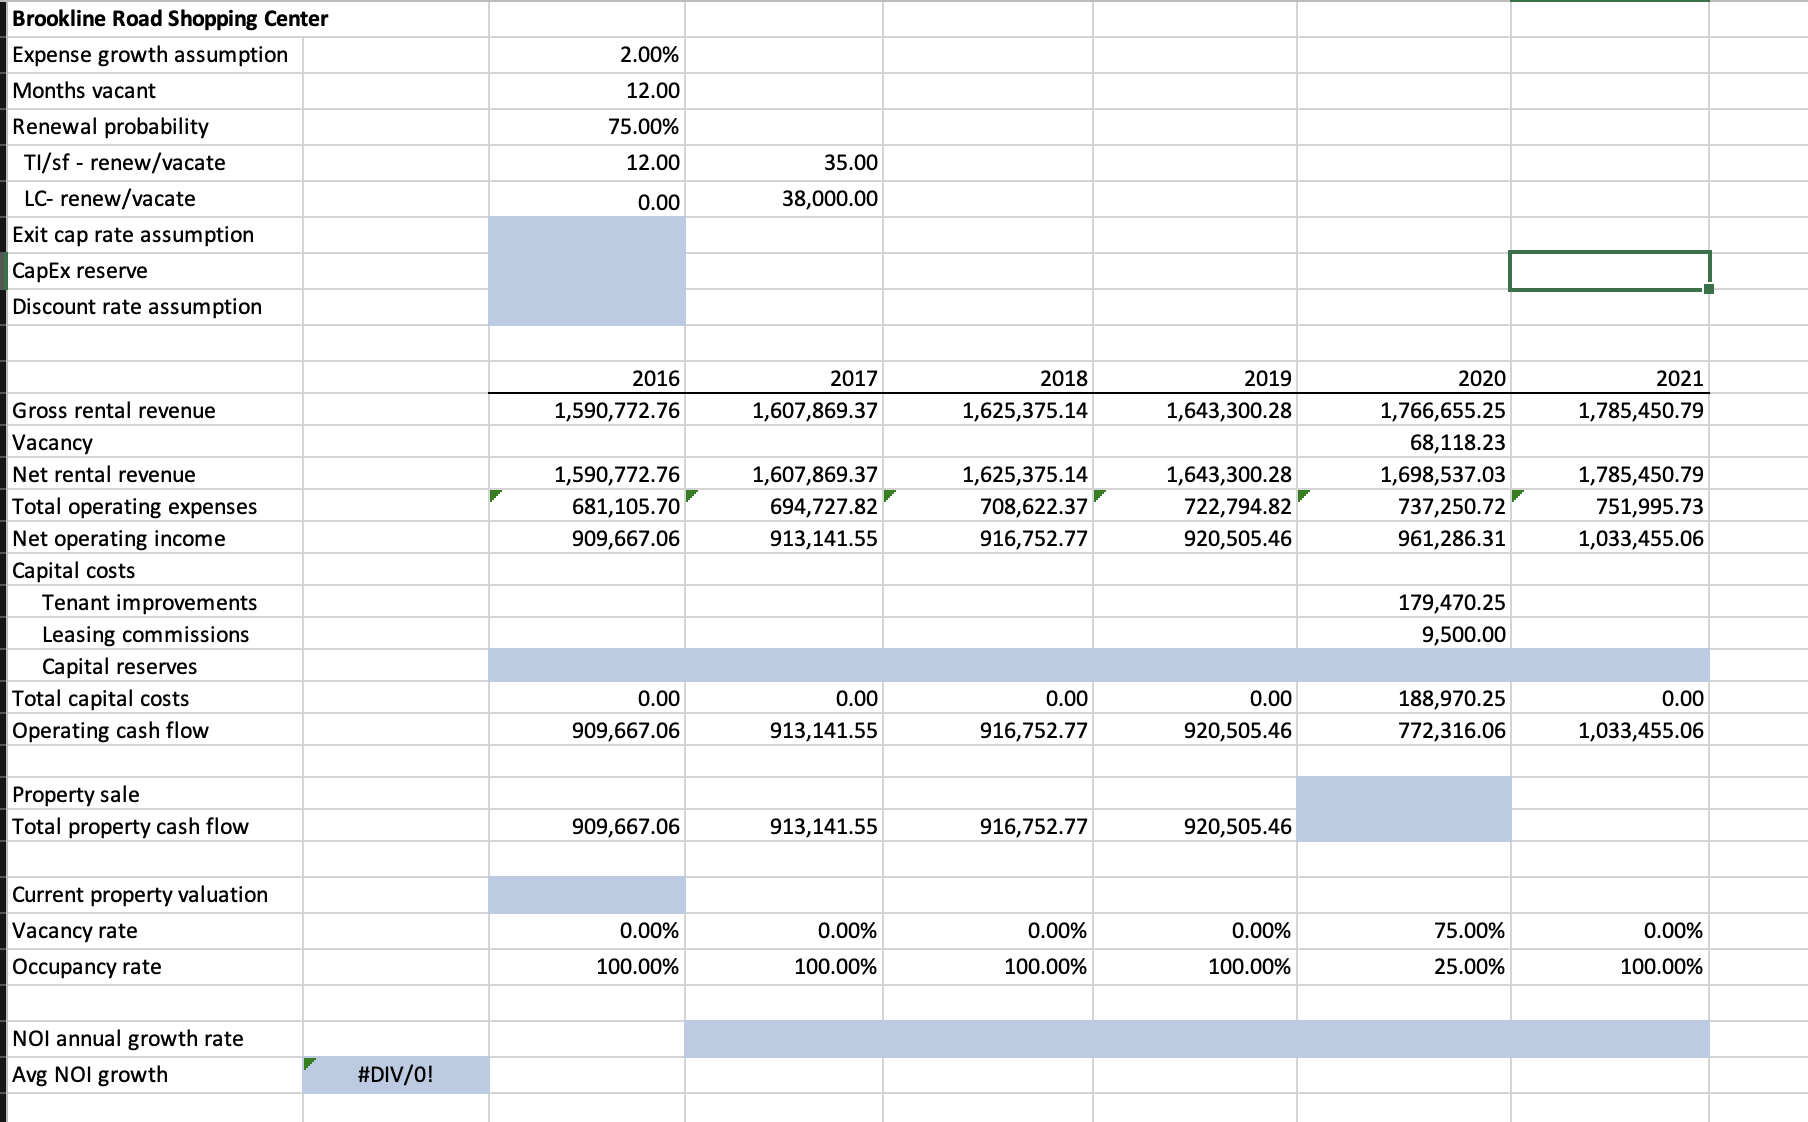
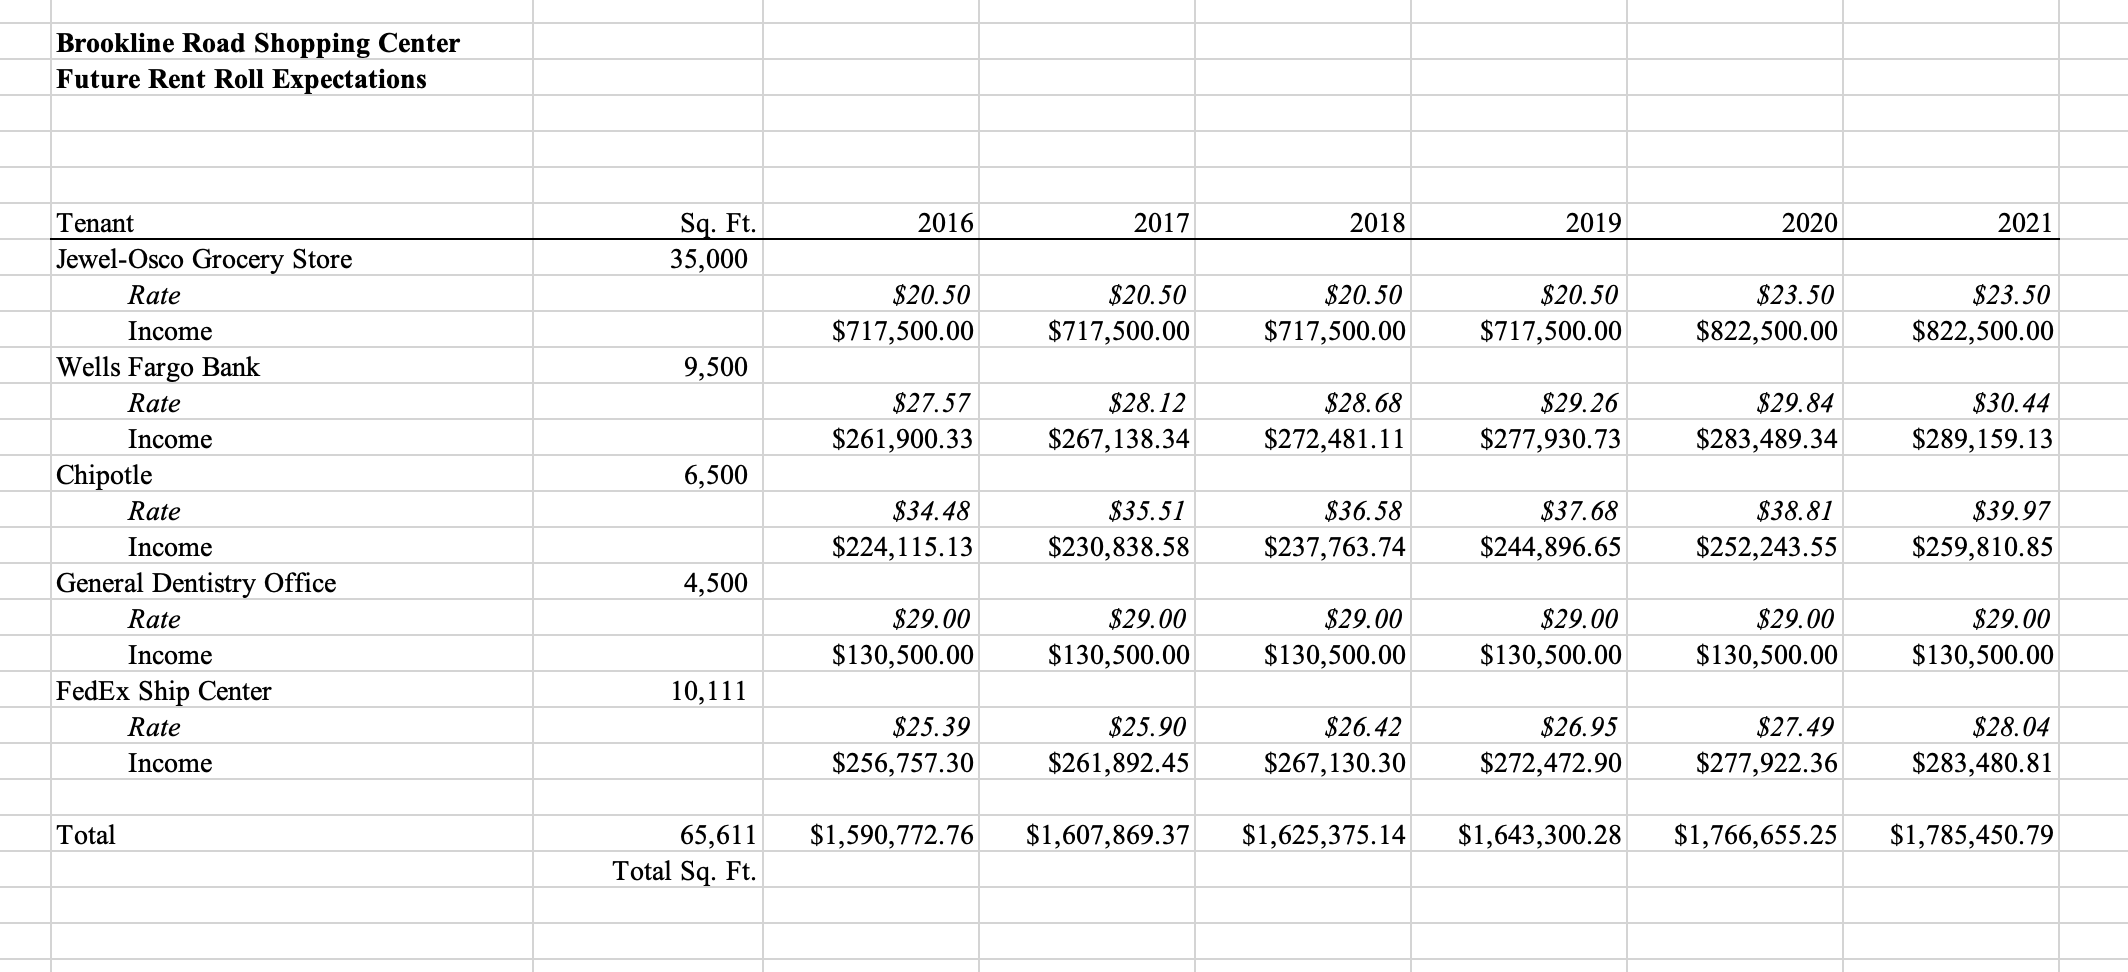
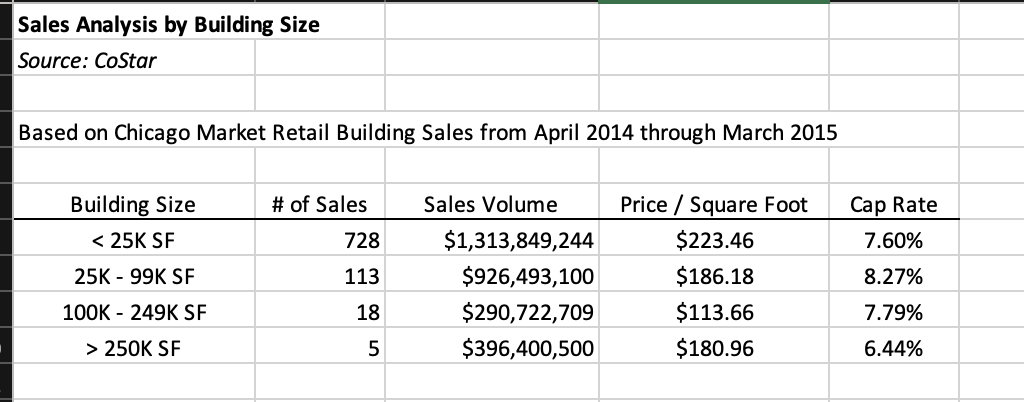
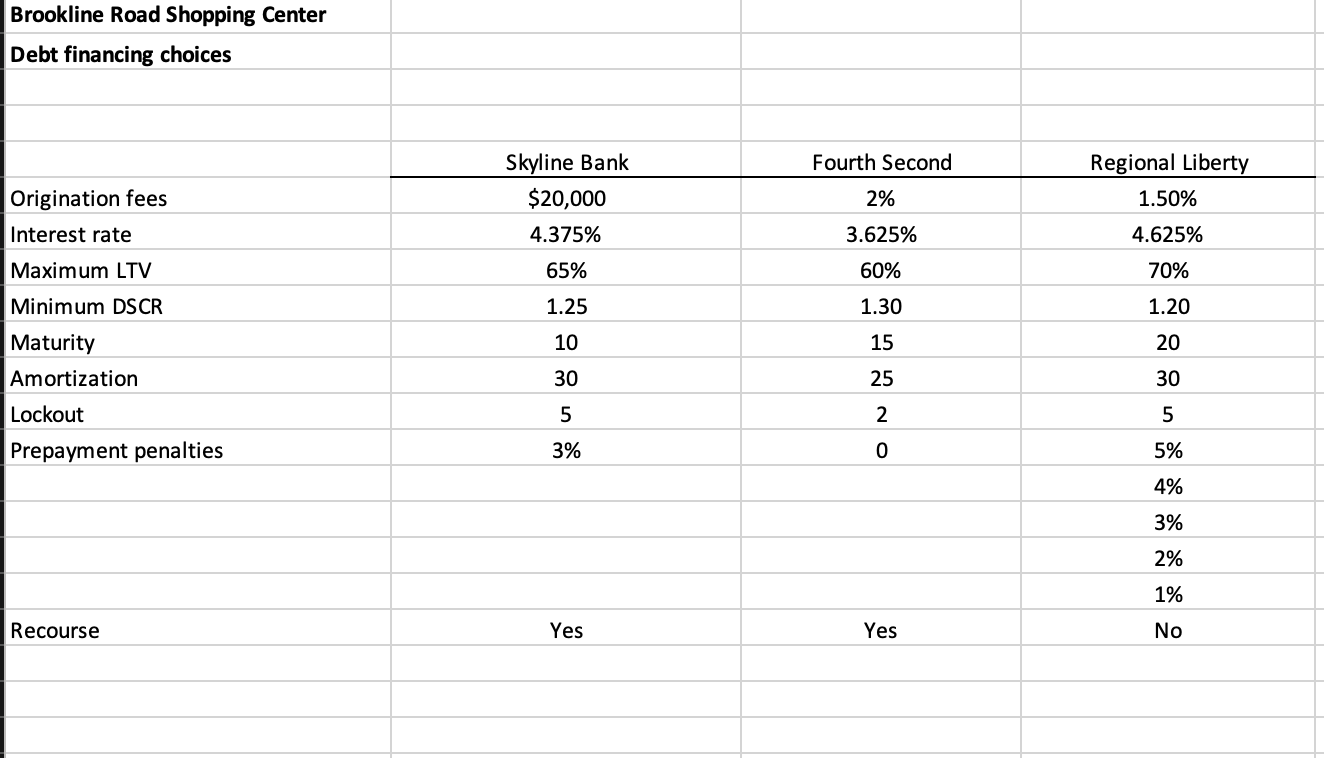
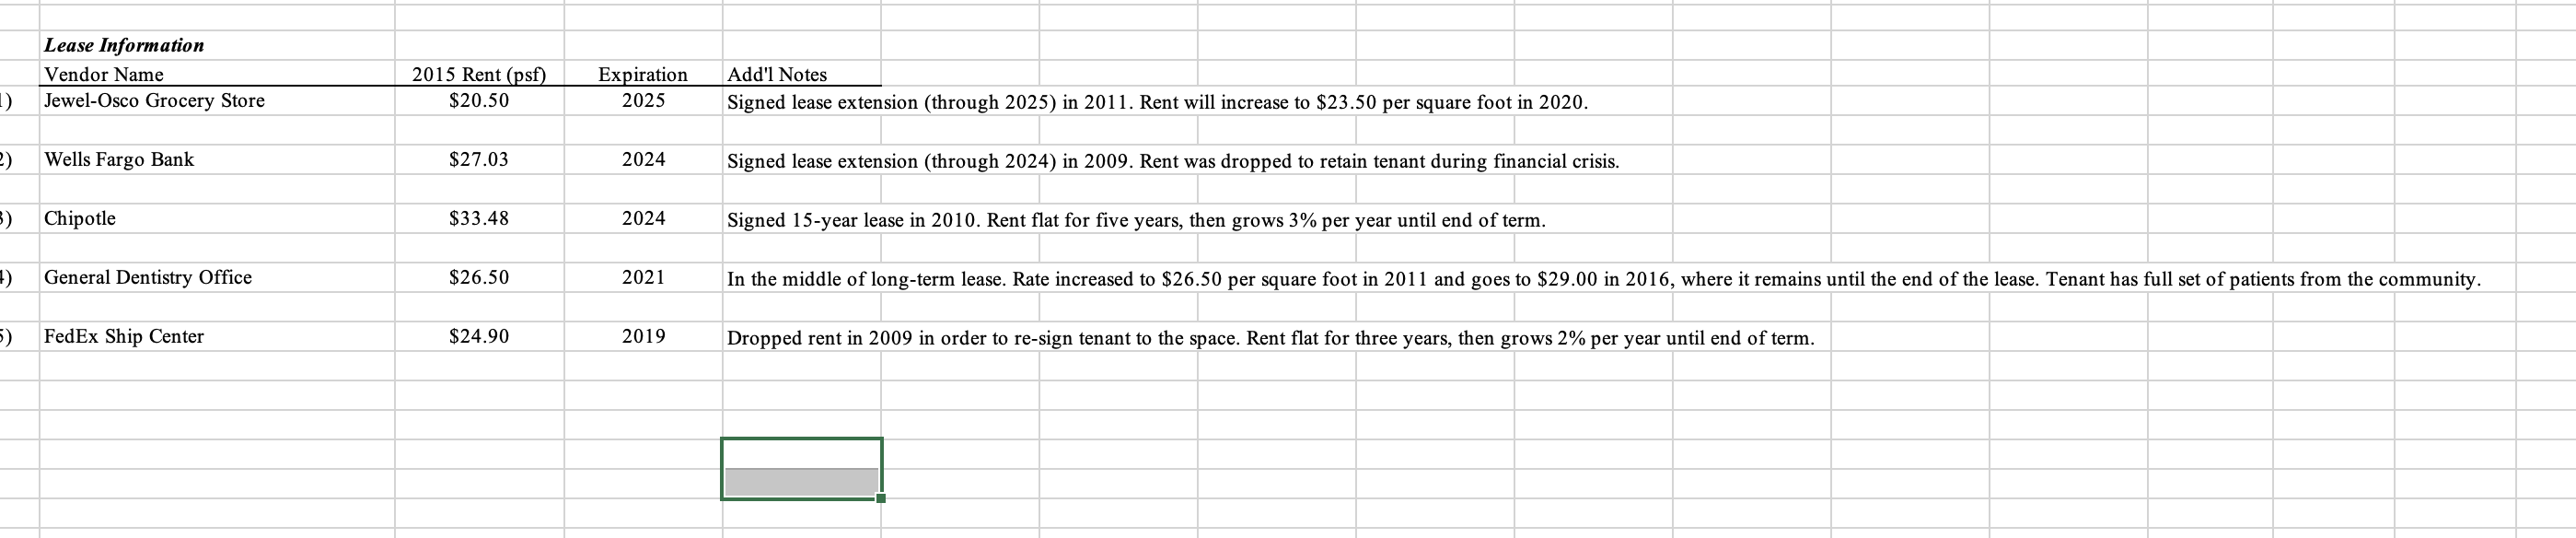 1. Determine a sale value for the property in year 5 based on the appropriate terminal cap rate from Exhibit 8 and projected NOI. To determine the appropriate discount rate for the property, use the given cap rate, proportion of NOI set aside for reserves, and the average growth rate of projected NOI. Assuming each lender is comfortable with the cash ow projections in Exhibit 11A, determine the maximum loan size for each of the three loan alternatives based on the given loan-to-value (LTV) and debt coverage ratio (DCR) requirements provided in Exhibit 3. If Mr. Cirano simply wanted to choose the largest loan possible, which lender would he choose? 2. Which of the three nancing choices will maximize Stanley Ciranos return on investment in the Brookline Road shopping center? For each of the three potential sources of nancing, project the before-tax cash ow based on a 8.27% cap rate, capital reserve of 17% of NOI, and corresponding discount rate. Determine the eective cost of borrowing and the before- tax IRR for each potential lender. Which loan generates the highest return? Does this correspond to the largest possible loan?
Step by Step Solution
There are 3 Steps involved in it
Step: 1

Get Instant Access to Expert-Tailored Solutions
See step-by-step solutions with expert insights and AI powered tools for academic success
Step: 2

Step: 3
Ace Your Homework with AI
Get the answers you need in no time with our AI-driven, step-by-step assistance
Get Started
The Investors Guidebook To Fixed Income Investments
Authors: Stuart R. Veale
1st Edition
0735205310, 978-0735205314