Answered step by step
Verified Expert Solution
Question
1 Approved Answer
1. Develop a forecasting model, justifying its selection over other techniques, and project attendance through 2020. Using case study above and associated data. Southwestern University:
1. Develop a forecasting model, justifying its selection over other techniques, and project attendance through 2020.
Using case study above and associated data.
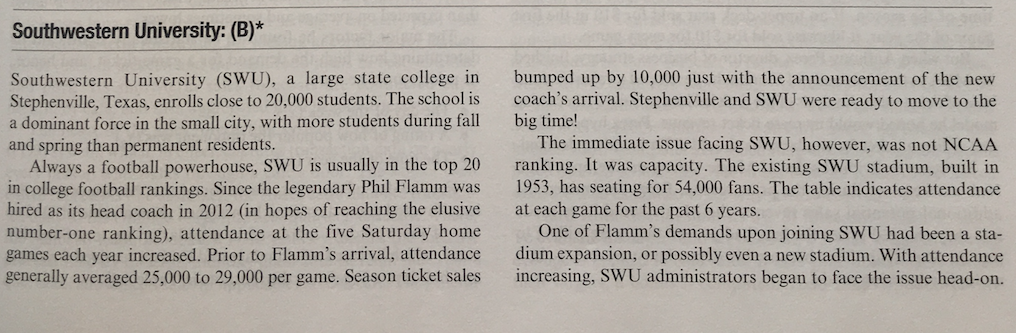
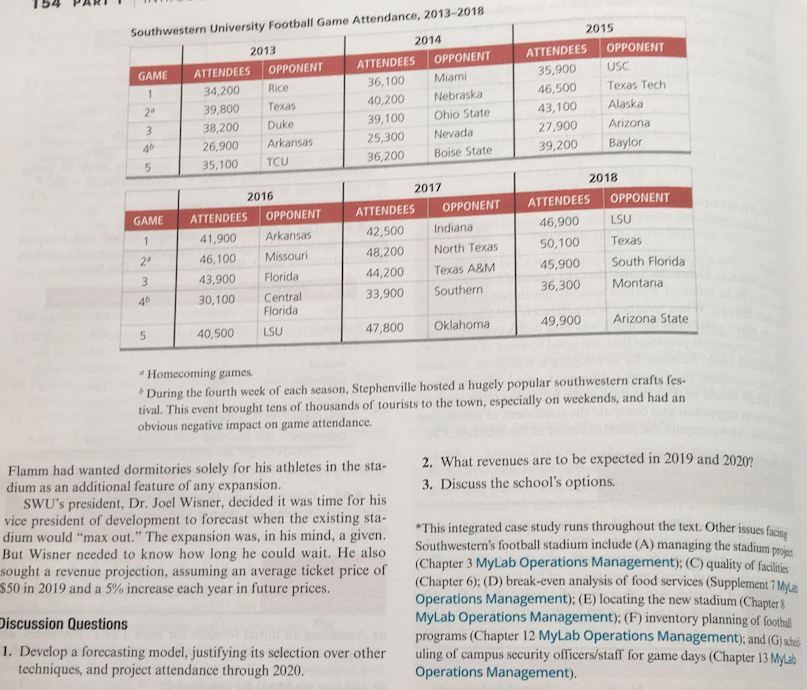
Southwestern University: (B)* Southwestern University (SWU), a large state college in Stephenville, Texas, enrolls close to 20,000 students. The school is a dominant force in the small city, with more students during fall and spring than permanent residents. Always a football powerhouse, SWU is usually in the top 20 in college football rankings. Since the legendary Phil Flamm was hired as its head coach in 2012 (in hopes of reaching the elusive number-one ranking), attendance at the five Saturday home games each year increased. Prior to Flamm's arrival, attendance generally averaged 25,000 to 29,000 per game. Season ticket sales bumped up by 10,000 just with the announcement of the new coach's arrival. Stephenville and SWU were ready to move to the big time! The immediate issue facing SWU, however, was not NCAA ranking. It was capacity. The existing SWU stadium, built in 1953, has seating for 54,000 fans. The table indicates attendance at each game for the past 6 years. One of Flamm's demands upon joining SWU had been a sta- dium expansion, or possibly even a new stadium. With attendance increasing, SWU administrators began to face the issue head-on. 154 PART 1 Southwestern University Football Game Attendance, 2013-2018 2014 2013 GAME OPPONENT ATTENDEES OPPONENT ATTENDEES Miami 34,200 36,100 Rice 39,800 20 Nebraska 40,200 Texas Ohio State 38,200 39,100 Duke Arkansas 26,900 Nevada 25,300 35,100 TCU 36,200 Boise State 2015 ATTENDEES OPPONENT 35,900 USC 46,500 Texas Tech 43,100 Alaska 27,900 Arizona 39,200 Baylor GAME 2016 ATTENDEES OPPONENT 41,900 Arkansas 46,100 Missouri 43,900 Florida 30,100 Central Florida 40,500 LSU 2017 ATTENDEES OPPONENT 42,500 Indiana 48,200 North Texas 44,200 Texas A&M 33,900 Southern 2018 ATTENDEES OPPONENT 46,900 50,100 Texas 45,900 South Florida 36,300 Montana Arizona State Oklahoma 47,800 "Homecoming games. During the fourth week of each season, Stephenville hosted a hugely popular southwestern crafts fes- tival. This event brought tens of thousands of tourists to the town, especially on weekends, and had an obvious negative impact on game attendance. 2. What revenues are to be expected in 2019 and 20202 3. Discuss the school's options. Flamm had wanted dormitories solely for his athletes in the sta- dium as an additional feature of any expansion. SWU's president, Dr. Joel Wisner, decided it was time for his vice president of development to forecast when the existing sta- dium would "max out." The expansion was, in his mind, a given. But Wisner needed to know how long he could wait. He also sought a revenue projection, assuming an average ticket price of $50 in 2019 and a 5% increase each year in future prices. *This integrated case study runs throughout the text. Other issues facin Southwestern's football stadium include (A) managing the stadium (Chapter 3 MyLab Operations Management); (C) quality of facilities (Chapter 6); (D) break-even analysis of food services (Supplement 7 ML Operations Management); (E) locating the new stadium (Chapter 8 MyLab Operations Management); (F) inventory planning of football programs (Chapter 12 MyLab Operations Management); and (G)s uling of campus security oflicers/staff for game days (Chapter 13 MyLab Operations Management). Discussion Questions 1. Develop a forecasting model, justifying its selection over other techniques, and project attendance through 2020. Southwestern University: (B)* Southwestern University (SWU), a large state college in Stephenville, Texas, enrolls close to 20,000 students. The school is a dominant force in the small city, with more students during fall and spring than permanent residents. Always a football powerhouse, SWU is usually in the top 20 in college football rankings. Since the legendary Phil Flamm was hired as its head coach in 2012 (in hopes of reaching the elusive number-one ranking), attendance at the five Saturday home games each year increased. Prior to Flamm's arrival, attendance generally averaged 25,000 to 29,000 per game. Season ticket sales bumped up by 10,000 just with the announcement of the new coach's arrival. Stephenville and SWU were ready to move to the big time! The immediate issue facing SWU, however, was not NCAA ranking. It was capacity. The existing SWU stadium, built in 1953, has seating for 54,000 fans. The table indicates attendance at each game for the past 6 years. One of Flamm's demands upon joining SWU had been a sta- dium expansion, or possibly even a new stadium. With attendance increasing, SWU administrators began to face the issue head-on. 154 PART 1 Southwestern University Football Game Attendance, 2013-2018 2014 2013 GAME OPPONENT ATTENDEES OPPONENT ATTENDEES Miami 34,200 36,100 Rice 39,800 20 Nebraska 40,200 Texas Ohio State 38,200 39,100 Duke Arkansas 26,900 Nevada 25,300 35,100 TCU 36,200 Boise State 2015 ATTENDEES OPPONENT 35,900 USC 46,500 Texas Tech 43,100 Alaska 27,900 Arizona 39,200 Baylor GAME 2016 ATTENDEES OPPONENT 41,900 Arkansas 46,100 Missouri 43,900 Florida 30,100 Central Florida 40,500 LSU 2017 ATTENDEES OPPONENT 42,500 Indiana 48,200 North Texas 44,200 Texas A&M 33,900 Southern 2018 ATTENDEES OPPONENT 46,900 50,100 Texas 45,900 South Florida 36,300 Montana Arizona State Oklahoma 47,800 "Homecoming games. During the fourth week of each season, Stephenville hosted a hugely popular southwestern crafts fes- tival. This event brought tens of thousands of tourists to the town, especially on weekends, and had an obvious negative impact on game attendance. 2. What revenues are to be expected in 2019 and 20202 3. Discuss the school's options. Flamm had wanted dormitories solely for his athletes in the sta- dium as an additional feature of any expansion. SWU's president, Dr. Joel Wisner, decided it was time for his vice president of development to forecast when the existing sta- dium would "max out." The expansion was, in his mind, a given. But Wisner needed to know how long he could wait. He also sought a revenue projection, assuming an average ticket price of $50 in 2019 and a 5% increase each year in future prices. *This integrated case study runs throughout the text. Other issues facin Southwestern's football stadium include (A) managing the stadium (Chapter 3 MyLab Operations Management); (C) quality of facilities (Chapter 6); (D) break-even analysis of food services (Supplement 7 ML Operations Management); (E) locating the new stadium (Chapter 8 MyLab Operations Management); (F) inventory planning of football programs (Chapter 12 MyLab Operations Management); and (G)s uling of campus security oflicers/staff for game days (Chapter 13 MyLab Operations Management). Discussion Questions 1. Develop a forecasting model, justifying its selection over other techniques, and project attendance through 2020Step by Step Solution
There are 3 Steps involved in it
Step: 1

Get Instant Access to Expert-Tailored Solutions
See step-by-step solutions with expert insights and AI powered tools for academic success
Step: 2

Step: 3
Ace Your Homework with AI
Get the answers you need in no time with our AI-driven, step-by-step assistance
Get Started