Question
1. Discuss quality management practices in organizations and how quality management facilitate organisational effectiveness. 2. Evaluate the importance of product and service design decisions and
1. Discuss quality management practices in organizations and how quality management facilitate organisational effectiveness. 2. Evaluate the importance of product and service design decisions and its impact on other design decisions and operations.
This is an individual task, where you are asked to conduct an independent work. You are asked to create only ONE product within the following, listed below: ? Personal Computer ? Suitcase ? Makeup product (e.g. any one item such as eyeshadows, foundation etc. ) Please choose only one product from the list above and follow instructions below.
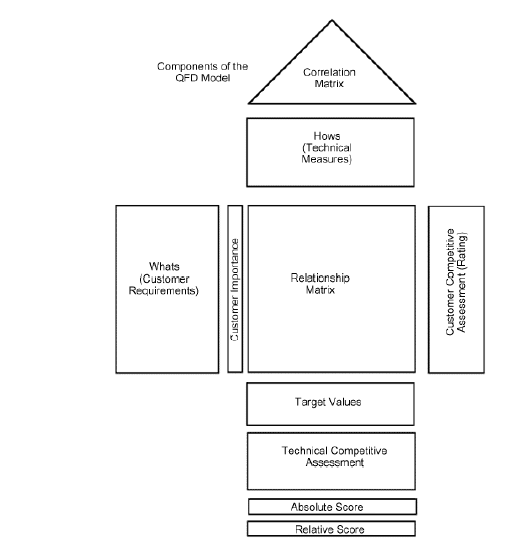
1. Conduct consumer and market research based on which construct the House of Quality (QFD) for a product.
i. Consider the development of your product design using House of Quality (QFD) template (available in intranet under "Assessments" folder). Decision on the product design is vital as it should reflect customer needs and expectations. In order to know what the customers' needs and expectations are (Customer Requirements), conduct a market research on what quality characteristics of your product are of most importance to the customers (avoid using general wording such as 'taste', 'quality' - be more specific); e.g. detailed description of the product, its features. Think of the name for your product, and make a new innovative feature in it, or a completely new innovative product (refer to the list of allowed products to be used above).
ii. Translate the Customer Requirements into Technical Characteristics/Measures/Requirements). iii. Evaluate the correlation matrix (the roof of QFD). iv. Evaluate the relationship matrix (relate customer requirements to the technical requirements). v. Conduct an evaluation of competing products (i.e. by comparing it to competitors' products e.g. vacuum cleaner offered by other brands i.e. Hoover and Dyson) and discuss how the new product can conform to customer expectations. You are asked to use only two (2) competitors. How will your price and features compare with your main two competitors- based on QFD evaluation of competing products?
Refer to STEPS FOR INCLUDING QFD TABLE IN THE COURSEWORK below. Hint: How will you obtain feedback about competitors' similar products? Use survey or other method for collecting customer information (primary data), also you are welcomed to use feedback about competitors' products which is available online in the internet (as secondary data). 2. Please, discuss Total Quality Management approach and justify why it is important for the company, discuss it theoretically as well. 3. Apply and discuss the six steps that lead to the conformance to specifications (present the steps in the form of a Table).
4. Describe the main and supporting processes related to the production of your product. 5. Apply and provide the graph of your input transformation output process with indication and discussion of transformed and transforming resources, type of transformation and final output. Do NOT discuss manufacturing / full cycle production process. 6. Apply three (3) Quality Control tools for process improvement for your product manufacturing, by stating a possible quality problem (or defects) along with the proposed solution for improvement). The three quality control tools for process improvement that you need to apply and discuss are: a. Pareto Diagram i. come up with the possible quality problem (defects), depending on the type of product you have selected; ii. state at least 8-10 defects; iii. provide a graph; iv. include the interpretation and discussion of the graph. b. Cause and Effect Diagram i. link Cause and Effect Diagram with the Pareto diagram: defect in the Pareto's 'big bar' should be put as a 'head' of the Cause and Effect diagram; ii. provide a graph - see template below (it should NOT be a picture, otherwise you will receive a zero); iii. by applying the 5 Whys technique when using the diagram, state at least 3 causes; iv. provide interpretation and discussion of the cause and effect diagram findings (based on your root cause analysis using 5 Whys technique).
c. Control Chart i. state the type of selected chart (either a c or np chart - see template below); ii. come up with possible defects or defectives, depending on the type of product and type of chart you have selected; iii. include at least 20 or 25 defects (or defectives) for either c or np chart, depending on the type of chart you have chosen; iv. provide a graph; v. include the calculations, formulas and interpretation of your findings.
Note: The examples of application of the approach (Q2) and Quality Control improvement tools (Q6) should be provided along with the graphs, discussions, and justifications. These should be described with reference to quality and operations management theory and learned concepts. ? Provide concluding remarks. ? You should apply learned concepts, principles and theories in the field of quality & operations management in your report. ? Ensure that you reference appropriate literature and reference your work accordingly.
References

Step by Step Solution
There are 3 Steps involved in it
Step: 1

Get Instant Access to Expert-Tailored Solutions
See step-by-step solutions with expert insights and AI powered tools for academic success
Step: 2

Step: 3

Ace Your Homework with AI
Get the answers you need in no time with our AI-driven, step-by-step assistance
Get Started


