1. Discuss the importance of the knowledge of the cost of capital the selected company.
2. Calculate company cost of capital for, 2017, 2018, 2019, 2020 and 2021 financial years. Compare with the required rate of return and assess the actual performance.
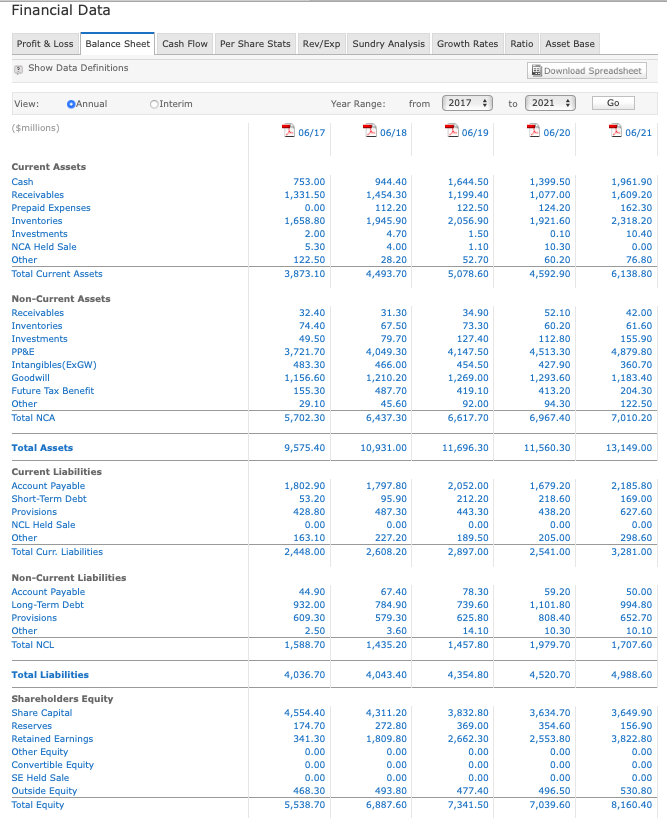
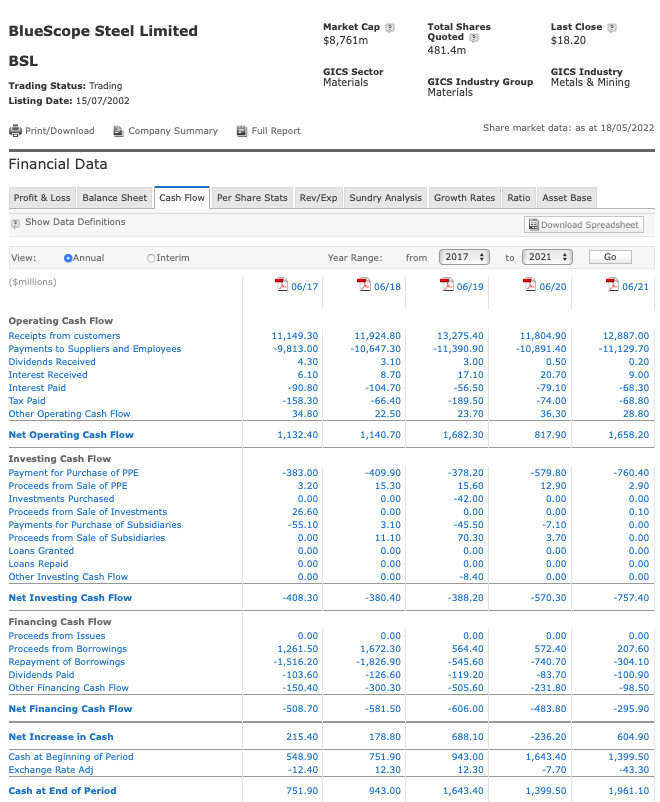
Financial Data Growth Rates Ratio Asset Base Profit & Loss Balance Sheet Cash Flow Per Share Stats Rev/Exp Sundry Analysis Show Data Definitions 2 Download Spreadsheet View: Annual Interim Year Range: from 2017 to 2021 Go ($millions) 06/17 06/18 06/19 06/20 06/21 753.00 1,331.50 0.00 1,658.80 2.00 5.30 122.50 3,873.10 944.40 1,454.30 112.20 1,945.90 4.70 4.00 28.20 4,493.70 1,644.50 1,199.40 122.50 2,056.90 1.50 1.10 52.70 5,078.60 1,399.50 1,077.00 124.20 1,921.60 0.10 10.30 60.20 4,592.90 1,961.90 1,609.20 162.30 2,318.20 10.40 0.00 76.80 6,138.80 Current Assets Cash Receivables Prepaid Expenses Inventories Investments NCA Held Sale Other Total Current Assets Non-Current Assets Receivables Inventories Investments PP&E Intangibles(ExGW) Goodwill Future Tax Benefit Other Total NCA 32.40 74.40 49.50 3,721.70 483.30 1,156.60 155.30 29.10 5,702.30 31.30 67.50 79.70 4,049.30 466.00 1,210.20 487.70 45.60 6,437.30 34.90 73.30 127.40 4,147.50 454.50 1,269.00 419.10 92.00 6,617.70 52.10 60.20 112.80 4,513.30 427.90 1,293.60 413.20 94.30 6,967.40 42.00 61.60 155.90 4,879.80 360.70 1,183.40 204.30 122.50 7,010.20 9,575.40 10,931.00 11,696.30 11,560.30 13,149.00 Total Assets Current Liabilities Account Payable Short-Term Debt Provisions NCL Held Sale Other Total Curr. Liabilities 1,802.90 53.20 428.80 0.00 163.10 2,448.00 1,797.80 95.90 487.30 0.00 227.20 2,608.20 2,052.00 212.20 443.30 0.00 189.50 2,897.00 1,679.20 218.60 438.20 0.00 205.00 2,541.00 2,185.80 169.00 627.60 0.00 298.60 3,281.00 Non-Current Liabilities Account Payable Long-Term Debt Provisions Other Total NCL 44.90 932.00 609.30 2.50 1,588.70 67.40 784.90 579.30 3.60 1,435.20 78.30 739.60 625.80 14.10 1,457.80 59.20 1,101.80 808.40 10.30 1,979.70 50.00 994.80 652.70 10.10 1,707.60 Total Liabilities 4,036.70 4,043.40 4,354.80 4,520.70 4,988.60 Shareholders Equity Share Capital Reserves Retained Earnings Other Equity Convertible Equity SE Held Sale Outside Equity Total Equity 4,554.40 174.70 341.30 0.00 0.00 0.00 468.30 5,538.70 4,311.20 272.80 1,809.80 0.00 0.00 0.00 493.80 6,887.60 3,832.80 369.00 2,662.30 0.00 0.00 0.00 477.40 7,341.50 3,634.70 354.60 2,553.80 0.00 0.00 0.00 496.50 7,039.60 3,649.90 156.90 3,822.80 0.00 0.00 0.00 530.80 8,160.40 Market Cap $8,761m Total Shares Quoted 481.4m Last Close $18.20 BlueScope Steel Limited BSL Trading Status: Trading Listing Date: 15/07/2002 GICS Sector Materials GICS Industry Group Materials GICS Industry Metals & Mining I Print/Download Company Summary Full Report Share market data: as at 18/05/2022 Financial Data Profit & Loss Balance Sheet Cash Flow Per Share Stats Rev/Exp Sundry Analysis Growth Rates Ratio Asset Base Show Data Definitions Download Spreadsheet View: Annual Interim Year Range: from 2017 to 2021 Go ($millions) 06/17 06/18 06/19 06/20 06/21 11,804.90 -10,891.40 0.50 11,149.30 -9,813.00 4.30 6.10 -90.80 -158.30 34.80 11,924.80 -10,647.30 3.10 8.70 -104.70 -66.40 22.50 13,275.40 -11,390.90 3.00 17.10 -56.50 -189.50 23.70 20.70 -79.10 -74.00 36.30 12,887.00 -11,129.70 0.20 9.00 -68.30 -68.80 28.80 1,132.40 1,140.70 1,682.30 817.90 1,658.20 -409.90 15.30 0.00 Operating Cash Flow Receipts from customers Payments to Suppliers and Employees Dividends Received Interest Received Interest Paid Tax Paid Other Operating Cash Flow Net Operating Cash Flow Investing Cash Flow Payment for Purchase of PPE Proceeds from Sale of PPE Investments Purchased Proceeds from Sale of Investments Payments for Purchase of Subsidiaries Proceeds from Sale of Subsidiaries Loans Granted Loans Repaid Other Investing Cash Flow Net Investing Cash Flow Financing Cash Flow Proceeds from Issues Proceeds from Borrowings Repayment of Borrowings Dividends Paid Other Financing Cash Flow Net Financing Cash Flow 0.00 -383.00 3.20 0.00 26.60 -55.10 0.00 0.00 0.00 0.00 3.10 11.10 0.00 0.00 0.00 -378.20 15.60 -42.00 0.00 -45.50 70.30 0.00 0.00 -8.40 -579.80 12.90 0.00 0.00 -7.10 3.70 0.00 0.00 0.00 -760.40 2.90 0.00 0.10 0.00 0.00 0.00 0.00 0.00 -408.30 -380.40 -388.20 -570.30 -757.40 0.00 1,261.50 -1,516.20 -103.60 - 150.40 0.00 1,672.30 -1,826.90 -126.60 -300.30 0.00 564.40 -545.60 -119.20 -505.60 0.00 572.40 - 740.70 -83.70 -231.80 0.00 207.60 -304.10 -100.90 -98.50 -508.70 -581.50 -606.00 -483.80 -295.90 215.40 178.80 688.10 -236.20 604.90 Net Increase in Cash Cash at Beginning of Period Exchange Rate Adj Cash at End of Period 548.90 - 12.40 751.90 12.30 943.00 12.30 1,643.40 -7.70 1,399.50 -43.30 751.90 943.00 1,643.40 1,399.50 1,961.10 Financial Data Growth Rates Ratio Asset Base Profit & Loss Balance Sheet Cash Flow Per Share Stats Rev/Exp Sundry Analysis Show Data Definitions 2 Download Spreadsheet View: Annual Interim Year Range: from 2017 to 2021 Go ($millions) 06/17 06/18 06/19 06/20 06/21 753.00 1,331.50 0.00 1,658.80 2.00 5.30 122.50 3,873.10 944.40 1,454.30 112.20 1,945.90 4.70 4.00 28.20 4,493.70 1,644.50 1,199.40 122.50 2,056.90 1.50 1.10 52.70 5,078.60 1,399.50 1,077.00 124.20 1,921.60 0.10 10.30 60.20 4,592.90 1,961.90 1,609.20 162.30 2,318.20 10.40 0.00 76.80 6,138.80 Current Assets Cash Receivables Prepaid Expenses Inventories Investments NCA Held Sale Other Total Current Assets Non-Current Assets Receivables Inventories Investments PP&E Intangibles(ExGW) Goodwill Future Tax Benefit Other Total NCA 32.40 74.40 49.50 3,721.70 483.30 1,156.60 155.30 29.10 5,702.30 31.30 67.50 79.70 4,049.30 466.00 1,210.20 487.70 45.60 6,437.30 34.90 73.30 127.40 4,147.50 454.50 1,269.00 419.10 92.00 6,617.70 52.10 60.20 112.80 4,513.30 427.90 1,293.60 413.20 94.30 6,967.40 42.00 61.60 155.90 4,879.80 360.70 1,183.40 204.30 122.50 7,010.20 9,575.40 10,931.00 11,696.30 11,560.30 13,149.00 Total Assets Current Liabilities Account Payable Short-Term Debt Provisions NCL Held Sale Other Total Curr. Liabilities 1,802.90 53.20 428.80 0.00 163.10 2,448.00 1,797.80 95.90 487.30 0.00 227.20 2,608.20 2,052.00 212.20 443.30 0.00 189.50 2,897.00 1,679.20 218.60 438.20 0.00 205.00 2,541.00 2,185.80 169.00 627.60 0.00 298.60 3,281.00 Non-Current Liabilities Account Payable Long-Term Debt Provisions Other Total NCL 44.90 932.00 609.30 2.50 1,588.70 67.40 784.90 579.30 3.60 1,435.20 78.30 739.60 625.80 14.10 1,457.80 59.20 1,101.80 808.40 10.30 1,979.70 50.00 994.80 652.70 10.10 1,707.60 Total Liabilities 4,036.70 4,043.40 4,354.80 4,520.70 4,988.60 Shareholders Equity Share Capital Reserves Retained Earnings Other Equity Convertible Equity SE Held Sale Outside Equity Total Equity 4,554.40 174.70 341.30 0.00 0.00 0.00 468.30 5,538.70 4,311.20 272.80 1,809.80 0.00 0.00 0.00 493.80 6,887.60 3,832.80 369.00 2,662.30 0.00 0.00 0.00 477.40 7,341.50 3,634.70 354.60 2,553.80 0.00 0.00 0.00 496.50 7,039.60 3,649.90 156.90 3,822.80 0.00 0.00 0.00 530.80 8,160.40 Market Cap $8,761m Total Shares Quoted 481.4m Last Close $18.20 BlueScope Steel Limited BSL Trading Status: Trading Listing Date: 15/07/2002 GICS Sector Materials GICS Industry Group Materials GICS Industry Metals & Mining I Print/Download Company Summary Full Report Share market data: as at 18/05/2022 Financial Data Profit & Loss Balance Sheet Cash Flow Per Share Stats Rev/Exp Sundry Analysis Growth Rates Ratio Asset Base Show Data Definitions Download Spreadsheet View: Annual Interim Year Range: from 2017 to 2021 Go ($millions) 06/17 06/18 06/19 06/20 06/21 11,804.90 -10,891.40 0.50 11,149.30 -9,813.00 4.30 6.10 -90.80 -158.30 34.80 11,924.80 -10,647.30 3.10 8.70 -104.70 -66.40 22.50 13,275.40 -11,390.90 3.00 17.10 -56.50 -189.50 23.70 20.70 -79.10 -74.00 36.30 12,887.00 -11,129.70 0.20 9.00 -68.30 -68.80 28.80 1,132.40 1,140.70 1,682.30 817.90 1,658.20 -409.90 15.30 0.00 Operating Cash Flow Receipts from customers Payments to Suppliers and Employees Dividends Received Interest Received Interest Paid Tax Paid Other Operating Cash Flow Net Operating Cash Flow Investing Cash Flow Payment for Purchase of PPE Proceeds from Sale of PPE Investments Purchased Proceeds from Sale of Investments Payments for Purchase of Subsidiaries Proceeds from Sale of Subsidiaries Loans Granted Loans Repaid Other Investing Cash Flow Net Investing Cash Flow Financing Cash Flow Proceeds from Issues Proceeds from Borrowings Repayment of Borrowings Dividends Paid Other Financing Cash Flow Net Financing Cash Flow 0.00 -383.00 3.20 0.00 26.60 -55.10 0.00 0.00 0.00 0.00 3.10 11.10 0.00 0.00 0.00 -378.20 15.60 -42.00 0.00 -45.50 70.30 0.00 0.00 -8.40 -579.80 12.90 0.00 0.00 -7.10 3.70 0.00 0.00 0.00 -760.40 2.90 0.00 0.10 0.00 0.00 0.00 0.00 0.00 -408.30 -380.40 -388.20 -570.30 -757.40 0.00 1,261.50 -1,516.20 -103.60 - 150.40 0.00 1,672.30 -1,826.90 -126.60 -300.30 0.00 564.40 -545.60 -119.20 -505.60 0.00 572.40 - 740.70 -83.70 -231.80 0.00 207.60 -304.10 -100.90 -98.50 -508.70 -581.50 -606.00 -483.80 -295.90 215.40 178.80 688.10 -236.20 604.90 Net Increase in Cash Cash at Beginning of Period Exchange Rate Adj Cash at End of Period 548.90 - 12.40 751.90 12.30 943.00 12.30 1,643.40 -7.70 1,399.50 -43.30 751.90 943.00 1,643.40 1,399.50 1,961.10