Answered step by step
Verified Expert Solution
Link Copied!

Question

1 Approved Answer

1) Distribution Shapes Determine the shape of each distribution shown below. Select an answer v Select an answer v Select an answer v Select an

1)

image text in transcribedimage text in transcribedimage text in transcribedimage text in transcribed
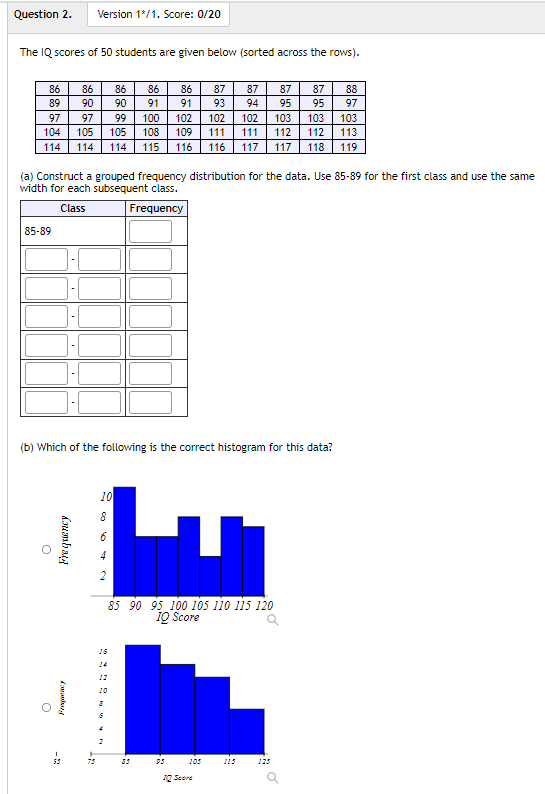
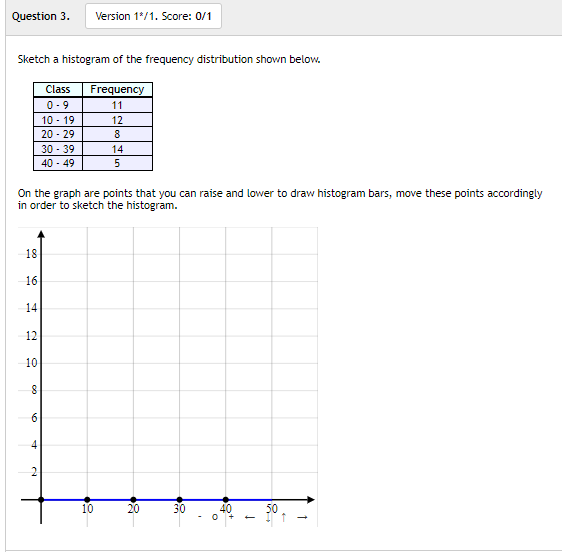
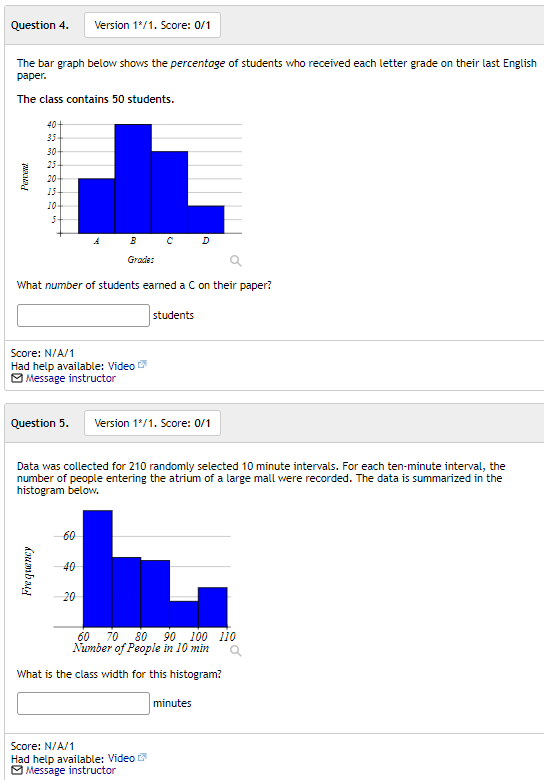
Distribution Shapes Determine the shape of each distribution shown below. Select an answer v Select an answer v Select an answer v Select an answer v Question 2. Version 1*/1. Score: 0/20 The IQ scores of 50 students are given below (sorted across the rows). 86 86 86 86 86 87 87 87 87 88 89 90 90 91 91 93 94 95 95 97 97 97 99 100 102 102 102 103 103 103 04 105 105 108 109 111 111 112 112 113 114 114 114 115 116 116 117 117 118 119 (a) Construct a grouped frequency distribution for the data. Use 85-89 for the first class and use the same width for each subsequent class, Class Frequency 85-89 (b) Which of the following is the correct histogram for this data? S Frequency O 85 90 95 100 105 110 125 120 10 Score Q O 105 aQuestion 3. Version 1*/1. Score: 0/1 Sketch a histogram of the frequency distribution shown below. Class Frequency 0 -9 11 10 - 19 12 20 - 29 8 30 - 39 14 40 - 49 5 On the graph are points that you can raise and lower to draw histogram bars, move these points accordingly in order to sketch the histogram. 18 16 14 12 10 6 4 2 10 20 30Question 4. Version 1*/1. Score: 0/1 The bar graph below shows the percentage of students who received each letter grade on their last English paper. The class contains 50 students. 40 35 30 20 C D Grades a What number of students earned a C on their paper? students Score: N/A/1 Had help available: Video Message instructor Question 5. Version 1*/1. Score: 0/1 Data was collected for 210 randomly selected 10 minute intervals. For each ten-minute interval, the number of people entering the atrium of a large mall were recorded. The data is summarized in the histogram below, 60 40 Frequency -20 60 70 80 90 100 110 Number of People in 10 min Q What is the class width for this histogram? minutes Score: N/A/1 Had help available: Video Message instructor

Step by Step Solution

There are 3 Steps involved in it

Step: 1

blur-text-image

Get Instant Access to Expert-Tailored Solutions

See step-by-step solutions with expert insights and AI powered tools for academic success

Step: 2

blur-text-image

Step: 3

blur-text-image

Ace Your Homework with AI

Get the answers you need in no time with our AI-driven, step-by-step assistance

Get Started

Recommended Textbook for

Trigonometry

Authors: Cynthia Y Young

5th Edition

1119820928, 9781119820925

More Books

Students also viewed these Mathematics questions

Question

Does it exceed two pages in length?

Answered: 1 week ago

Question

Does it avoid typos and grammatical errors?

Answered: 1 week ago