

Answered step by step
Verified Expert Solution
Question
1 Approved Answer
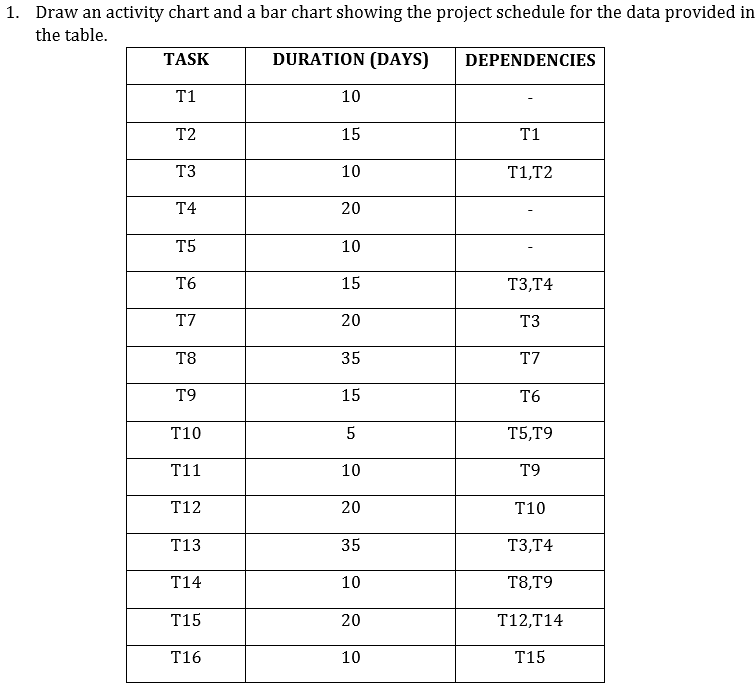
1. Draw an activity chart and a bar chart showing the project schedule for the data provided in the table. TASK DURATION (DAYS) DEPENDENCIES T1
Step by Step Solution
There are 3 Steps involved in it
Step: 1

Get Instant Access to Expert-Tailored Solutions
See step-by-step solutions with expert insights and AI powered tools for academic success
Step: 2

Step: 3
Ace Your Homework with AI
Get the answers you need in no time with our AI-driven, step-by-step assistance
Get Started
Pro PowerShell For Database Developers
Authors: Bryan P Cafferky
1st Edition
1484205413, 9781484205419