

Question
1. Estimate the value of equity for Top Car S.A., assuming that both divisions can maintain a growth rate of 3% to perpetuity, the company
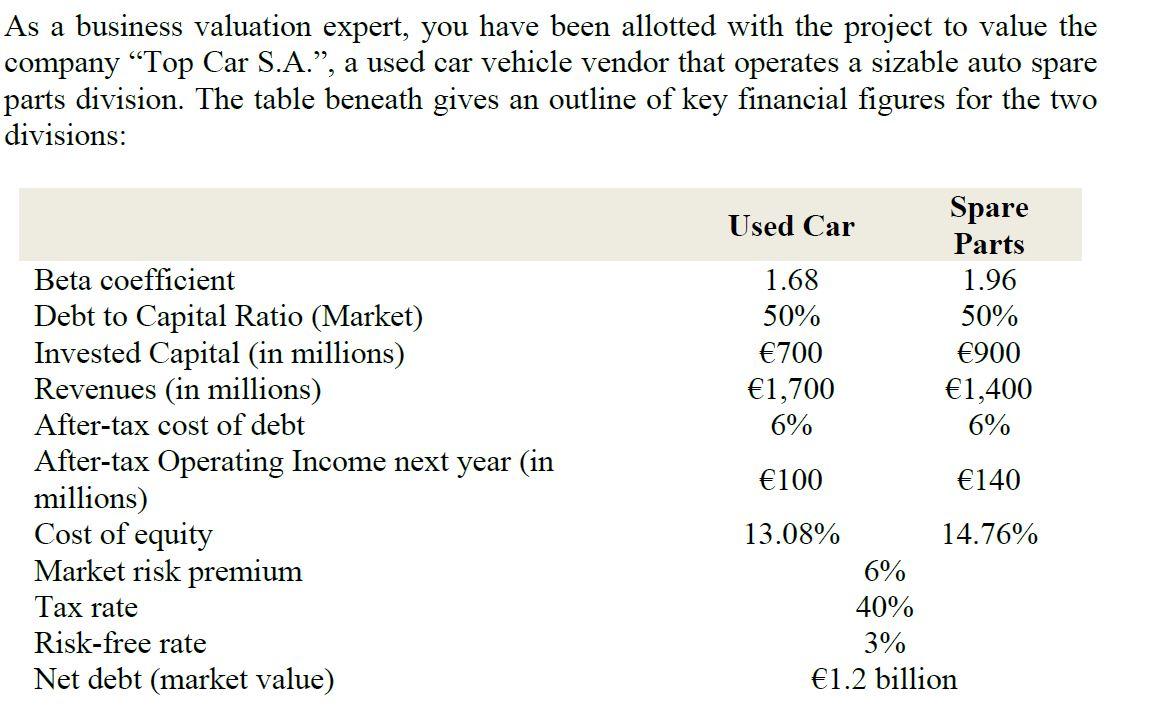 1. Estimate the value of equity for Top Car S.A., assuming that both divisions can maintain a growth rate of 3% to perpetuity, the company can continue to generate the current return on invested capital, and that Top Cars operating mix remains unchanged. 2. The companys top management is assessing the possibility to sell the used car division for an amount equivalent to Top Cars current debt outstanding. Following the divestiture of the used car business, the company is planning to use the proceeds from this sale to pay-off all debt obligations and to set as a goal to increase the firms after-tax operating margin to 15%. According to the companys business analysts the 15% increase in terms of after-tax operating margin can be achieved through raising the prices of the spare parts business. What is the value of Top Cars equity after the divestiture of the used car business assuming that the company continues to grow by 3% per annum forever? What is the change in the companys value of equity after the sale of the used car business?
Step by Step Solution
There are 3 Steps involved in it
Step: 1

Get Instant Access to Expert-Tailored Solutions
See step-by-step solutions with expert insights and AI powered tools for academic success
Step: 2

Step: 3
Ace Your Homework with AI
Get the answers you need in no time with our AI-driven, step-by-step assistance
Get Started
Mortgage And Interest Rates What You Should Know To Get A Risk Free Deal
Authors: Bert Rivers
1st Edition
979-8866678877