Answered step by step
Verified Expert Solution
Question
1 Approved Answer
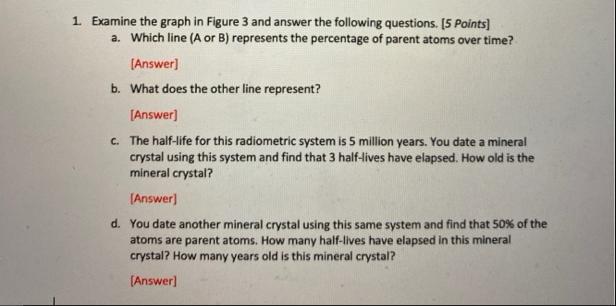
1. Examine the graph in Figure 3 and answer the following questions. [5 Points] a. Which line (A or B) represents the percentage of


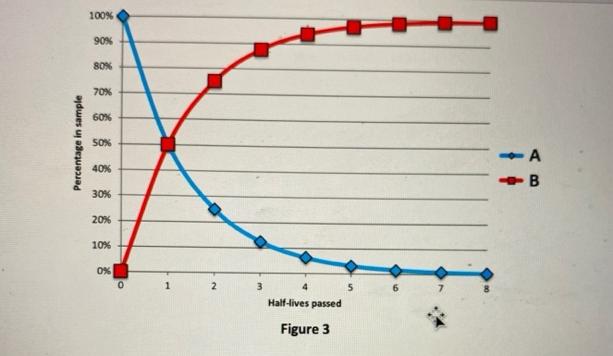
1. Examine the graph in Figure 3 and answer the following questions. [5 Points] a. Which line (A or B) represents the percentage of parent atoms over time? [Answer] b. What does the other line represent? [Answer] c. The half-life for this radiometric system is 5 million years. You date a mineral crystal using this system and find that 3 half-lives have elapsed. How old is the mineral crystal? [Answer] d. You date another mineral crystal using this same system and find that 50% of the atoms are parent atoms. How many half-lives have elapsed in this mineral crystal? How many years old is this mineral crystal? [Answer] Percentage in sample 100% 90% 80% 70% 60% 50% 40% 30% 20% 10% 0% 0 1 2 3 Half-lives passed Figure 3 A -B
Step by Step Solution
★★★★★
3.41 Rating (151 Votes )
There are 3 Steps involved in it
Step: 1
Ans Line A represents the time of parent atoms over generally it represents the decay rate o...
Get Instant Access to Expert-Tailored Solutions
See step-by-step solutions with expert insights and AI powered tools for academic success
Step: 2

Step: 3

Ace Your Homework with AI
Get the answers you need in no time with our AI-driven, step-by-step assistance
Get Started


