

Question
1. Examine the hospitals statements of cash flows. What information do they provide regarding the hospitals sources and uses of cash over the past two
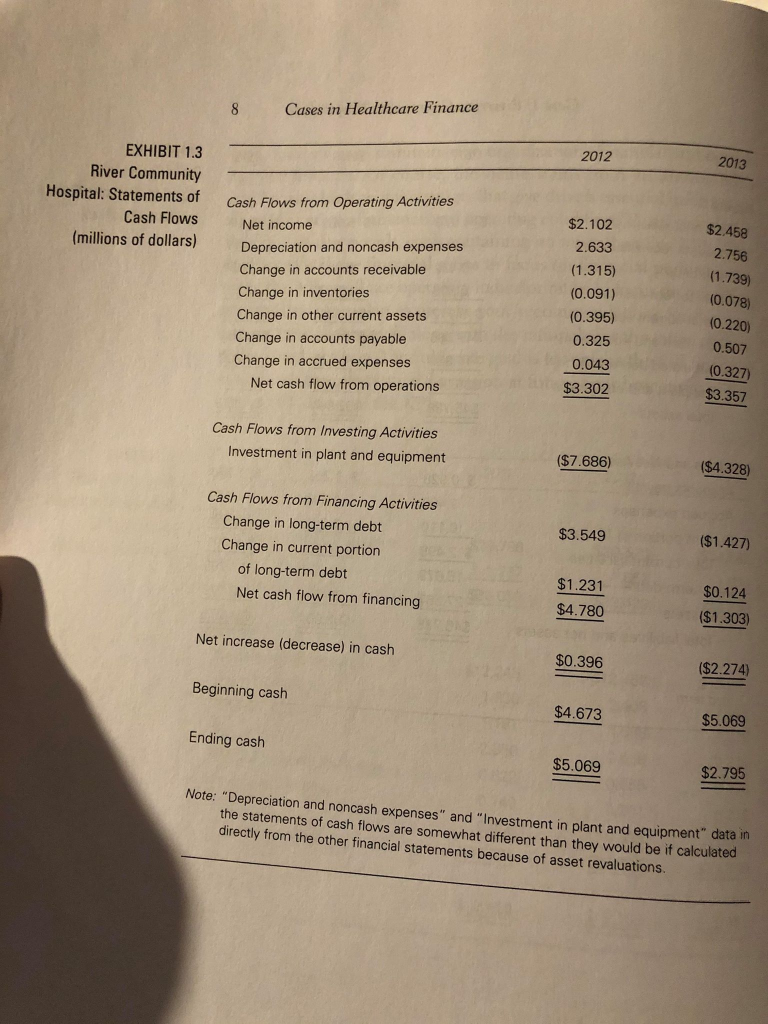
 1. Examine the hospitals statements of cash flows. What information do they provide regarding the hospitals sources and uses of cash over the past two years?
2. List five or more financial strengths of the hospital? (Hint: Do not provide a list of ratios. Make a statement and then justify it with information from the financial statements and ratios.)
3. List five or more financial weaknesses of the hospital? (Hint: Do not provide a list of ratios. Make a statement and then justify it with information from the financial statements and ratios.)
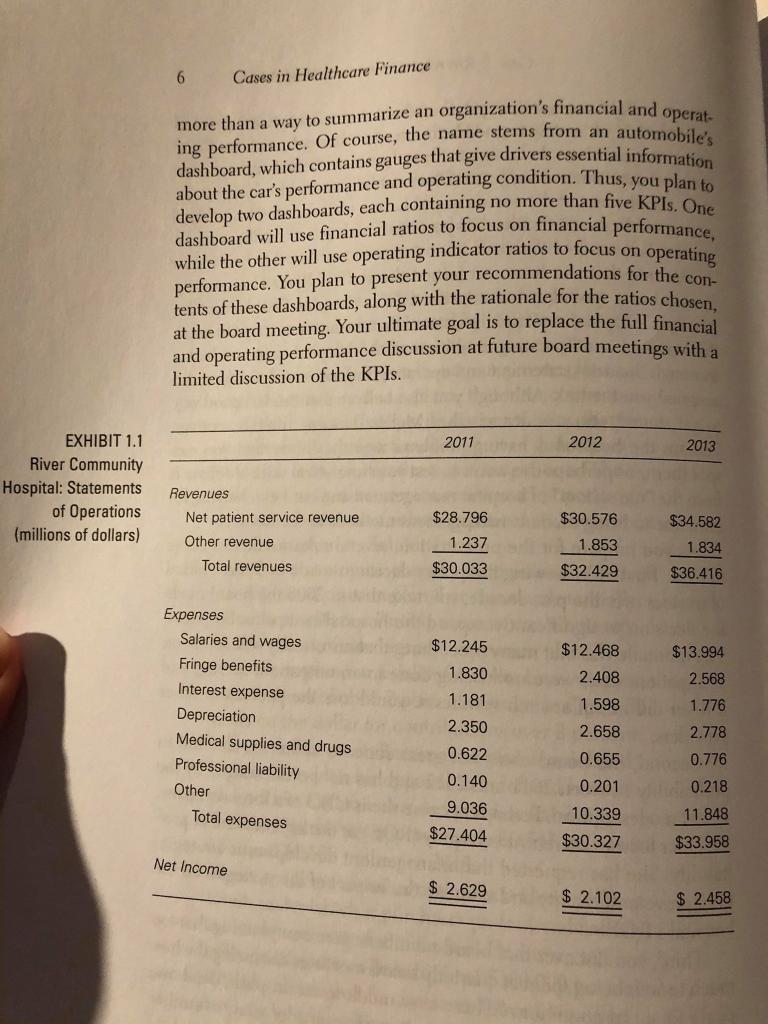
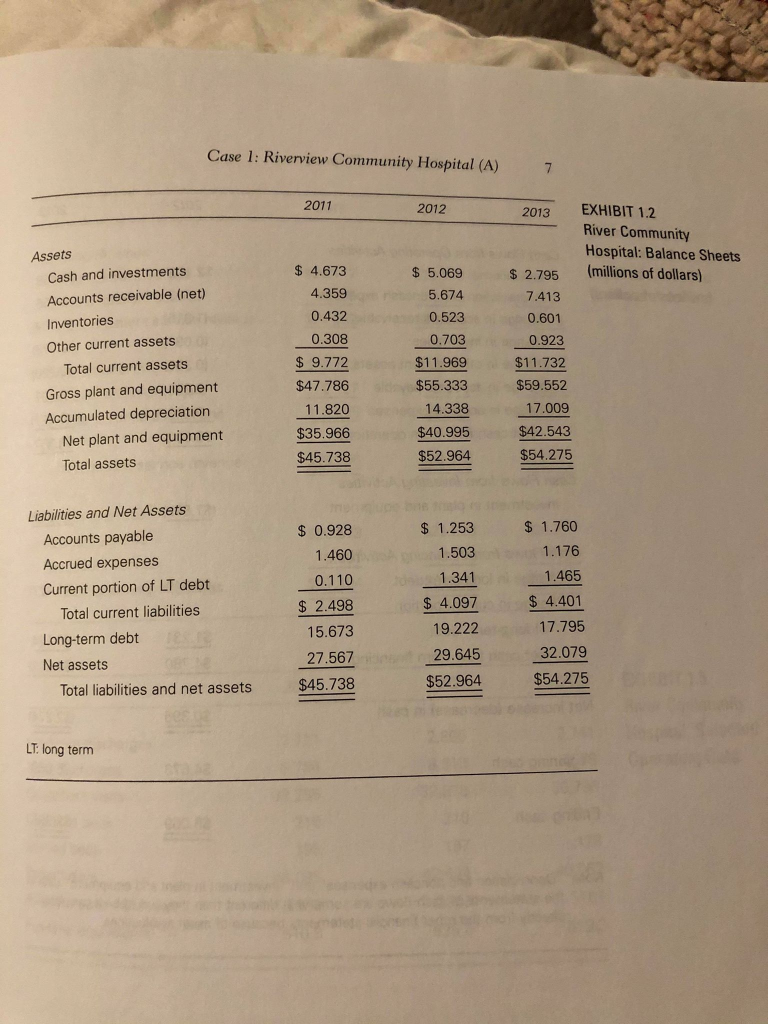
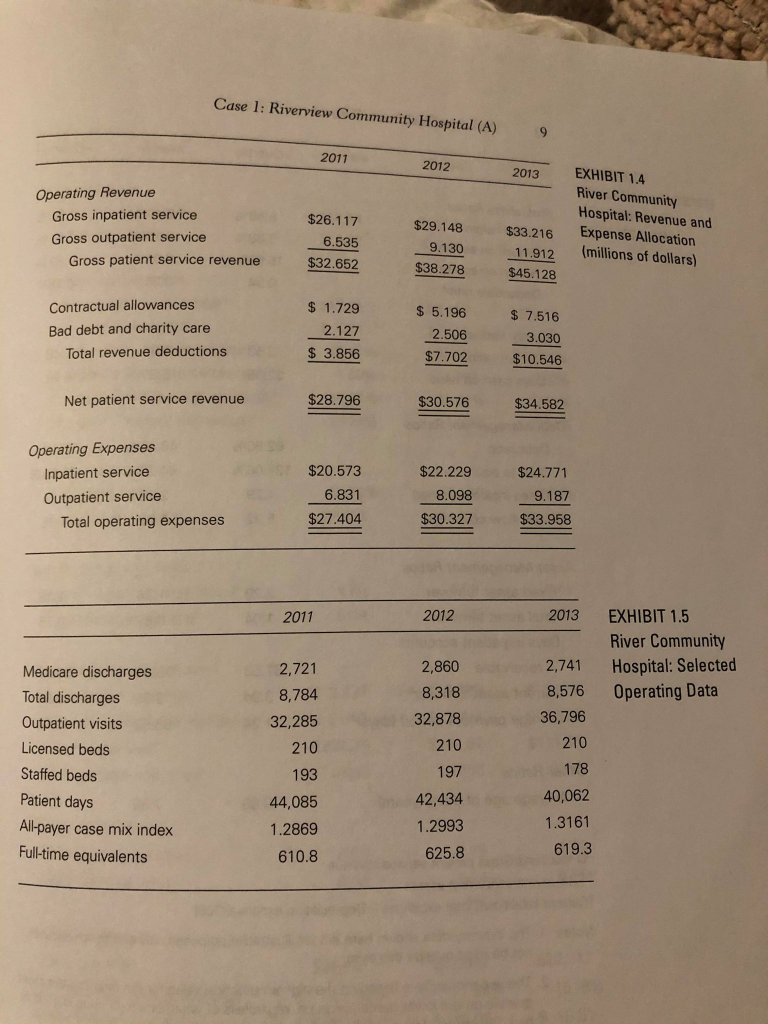
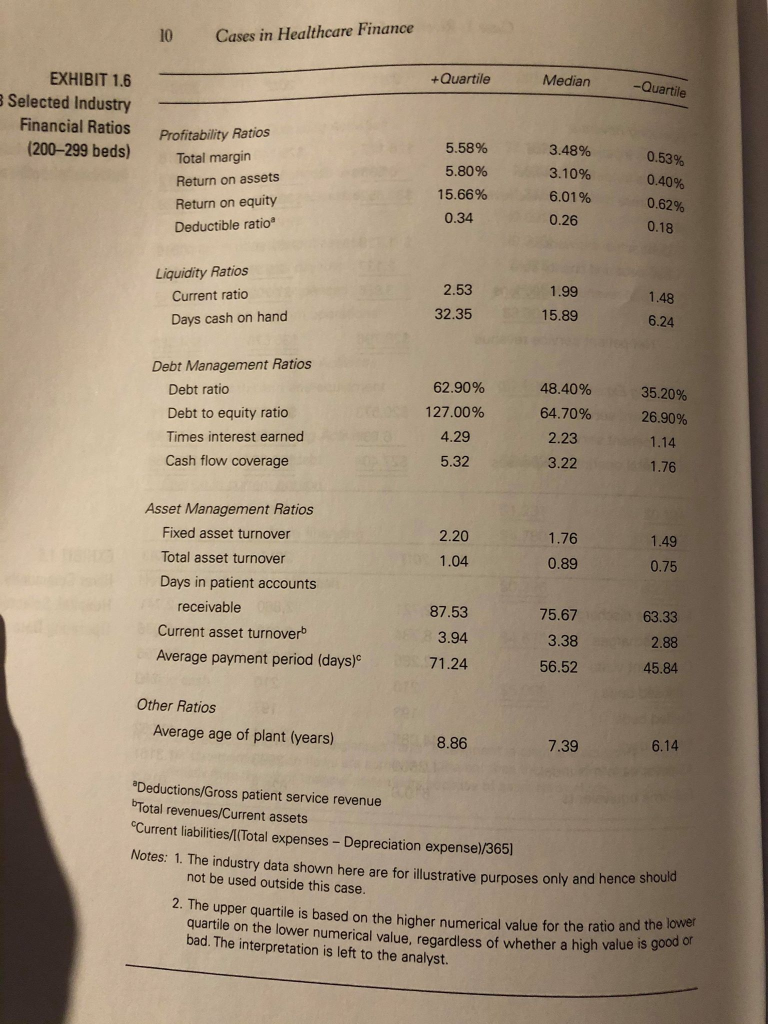
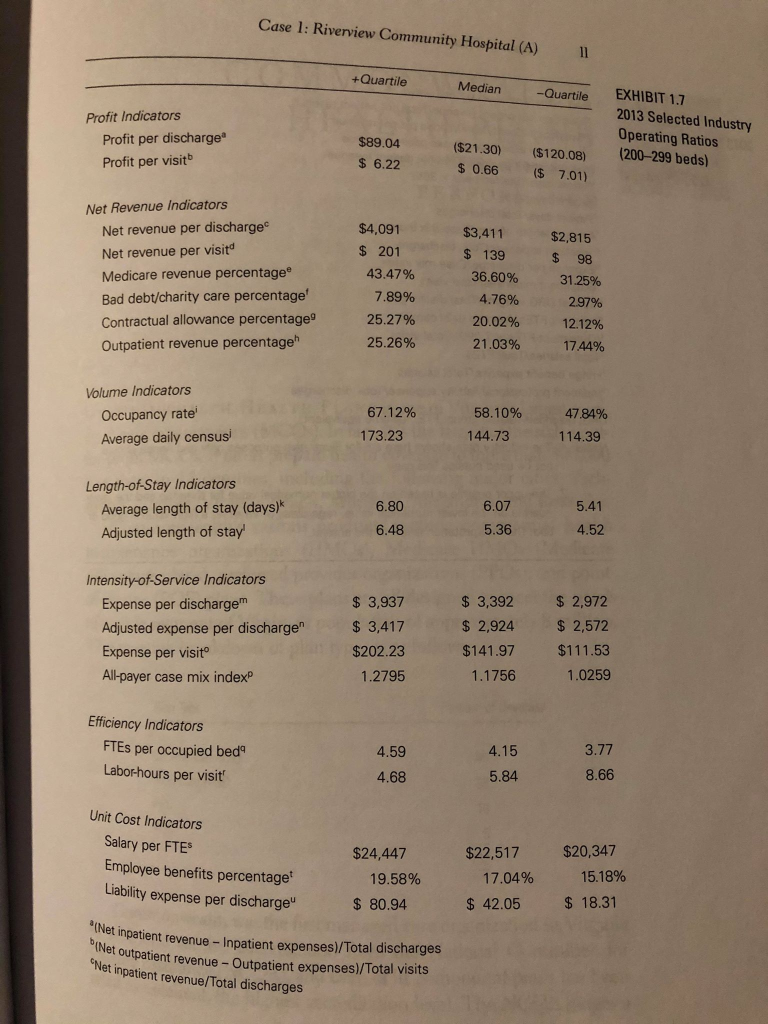
6 Cases in Healthcare Finance ation's financial and operat- me stems from an automobile's rivers essential information ing condition. Thus, you plan to an five KPIs. One on financial performance, ratios to focus on operating more than a way to summarize an organization's financial an ing performance. Of course, the name stems from an dashboard, which contains gauges that give drivers essential inform about the car's performance and operating condition. Thus, you develop two dashboards, each containing no more than five KPI dashboard will use financial ratios to focus on financial perform while the other will use operating indicator ratios to focus on performance. You plan to present your recommendations for the tents of these dashboards, along with the rationale for the ratios ch! at the board meeting. Your ultimate goal is to replace the full fin and operating performance discussion at future board meetings will limited discussion of the KPIs. 2011 2012 2013 EXHIBIT 1.1 River Community Hospital: Statements of Operations (millions of dollars) Revenues Net patient service revenue Other revenue Total revenues $28.796 1.237 $30.033 $30.576 1.853 $32.429 $34.582 1.834 $36.416 Expenses Salaries and wages Fringe benefits Interest expense Depreciation Medical supplies and drugs Professional liability Other Total expenses $12.245 1.830 1.181 2.350 0.622 0.140 9.036 $27.404 $12.468 2.408 1.598 2.658 0.655 0.201 10.339 $30.327 $13.994 2.568 1.776 2.778 0.776 0.218 11.848 $33.958 Net Income $ 2.629 $ 2.102 $ 2.458 Case 1: Riverview Community Hospital (A) 7 2011 2012 2013 EXHIBIT 1.2 River Community Hospital: Balance Sheets (millions of dollars) $ 5.069 5.674 Assets Cash and investments Accounts receivable (net) Inventories Other current assets Total current assets Gross plant and equipment Accumulated depreciation Net plant and equipment Total assets $ 4.673 4.359 0.432 0.308 $ 9.772 $47.786 11.820 $35.966 $45.738 0.703 $11.969 $55.333 14.338 $40.995 $52.964 $ 2.795 7.413 0.601 0.923 $11.732 $59.552 17.009 $42.543 $54.275 Liabilities and Net Assets Accounts payable Accrued expenses Current portion of LT debt Total current liabilities Long-term debt Net assets Total liabilities and net assets $ 0.928 1.460 0.110 $ 2.498 15.673 27.567 $45.738 $ 1.253 1.503 1.341 $ 4.097 19.222 29.645 $52.964 $ 1.760 1.176 1.465 $ 4.401 17.795 32.079 $54.275 LT: long term 8 Cases in Healthcare Finance 2012 2013 EXHIBIT 1.3 River Community Hospital: Statements of Cash Flows (millions of dollars) Cash Flows from Operating Activities Net income Depreciation and noncash expenses Change in accounts receivable Change in inventories Change in other current assets Change in accounts payable Change in accrued expenses Net cash flow from operations $2.102 2.633 (1.315) (0.091) (0.395) 0.325 0.043 $3.302 $2.458 2.756 (1.739) (0.078) (0.220) 0.507 (0.327) $3.357 Cash Flows from Investing Activities Investment in plant and equipment ($7.686) ($4.328) $3.549 Cash Flows from Financing Activities Change in long-term debt Change in current portion of long-term debt Net cash flow from financing ($1.427) $1.231 $4.780 $0.124 ($1.303) Net increase (decrease) in cash $0.396 ($2.274 Beginning cash $4.673 $5.069 Ending cash $5.069 $2.795 Note: "Depreciation and noncash expenses" and "Investment in plant and equipment" data in the statements of cash flows are somewhat different than they would be it calculated directly from the other financial statements because of asset revaluations. Case 1: Riverview Community Hospital (A) 9 2011 2012 2013 Operating Revenue Gross inpatient service Gross outpatient service Gross patient service revenue $26.117 6.535 $32.652 EXHIBIT 1.4 River Community Hospital: Revenue and Expense Allocation millions of dollars) $29.148 9.130 $38.278 $33.216 11.912 $45.128 Contractual allowances Bad debt and charity care Total revenue deductions $ 1.729 2.127 $ 3.856 $ 5.196 2.506 $7.702 $ 7.516 3.030 $10.546 Net patient service revenue $28.796 $30.576 $34.582 Operating Expenses Inpatient service Outpatient service Total operating expenses $20.573 6.831 $27.404 $22.229 8.098 $30.327 $24.771 9.187 $33.958 2011 2012 2013 2,721 8,784 32,285 210 EXHIBIT 1.5 River Community Hospital: Selected Operating Data Medicare discharges Total discharges Outpatient visits Licensed beds Staffed beds Patient days All-payer case mix index Full-time equivalents 2,860 8,318 32,878 210 197 42,434 1.2993 625.8 2,741 8,576 36,796 210 178 40,062 1.3161 619.3 193 44,085 1.2869 610.8 10 Cases in Healthcare Finance +Quartile Median -Quartile EXHIBIT 1.6 B Selected Industry Financial Ratios (200-299 beds) Profitability Ratios Total margin Return on assets Return on equity Deductible ratio 5.58% 5.80% 15.66% 0.34 3.48% 3.10% 6.01% 0.26 0.53% 0.40% 0.62% 0.18 Liquidity Ratios Current ratio Days cash on hand 1.99 2.53 32.35 1.48 15.89 6.24 Debt Management Ratios Debt ratio Debt to equity ratio Times interest earned Cash flow coverage 62.90% 127.00% 4.29 48.40% 64.70% 2.23 3.22 35.20% 26.90% 1.14 1.76 5.32 2.20 1.04 1.76 0.89 1.49 0.75 Asset Management Ratios Fixed asset turnover Total asset turnover Days in patient accounts receivable Current asset turnover Average payment period (days) 87.53 3.94 71.24 75.67 3.38 63.33 2.88 45.84 Other Ratios Average age of plant (years) 8.86 7.39 6.14 "Deductions/Gross patient service revenue bTotal revenues/Current assets "Current liabilities/t(Total expenses - Depreciation expense)/365) Notes: 1. The industry data shown here are for illustrative purposes only and hence not be used outside this case. 2. The upper quartile is based on the higher numerical value for the ratio and quartile on the lower numerical value, regardless of whether a high value bad. The interpretation is left to the analyst. value for the ratio and the lower ether a high value is good or Case 1: Riverview Community Hospital (A) 11 +Quartile Median -Quartile Profit Indicators Profit per discharge Profit per visit EXHIBIT 1.7 2013 Selected Industry Operating Ratios (200-299 beds) $89.04 $ 6.22 ($21.30) $ 0.66 ($120.08) $ 7.01) $2,815 $ 98 Net Revenue Indicators Net revenue per discharge Net revenue per visita Medicare revenue percentage Bad debt/charity care percentage Contractual allowance percentage Outpatient revenue percentage $4,091 $ 201 43.47% 7.89% 25.27% 25.26% 31.25% $3,411 $ 139 36.60% 4.76% 20.02% 21.03% 2.97% 17.44% Volume Indicators Occupancy rate Average daily censusi 67.12% 173.23 58.10% 144.73 47.84% 114.39 Length-of-Stay Indicators Average length of stay (days) Adjusted length of stay' 6.80 6.48 6.07 5.36 5.41 4.52 Intensity-of-Service Indicators Expense per dischargem Adjusted expense per discharge Expense per visit All-payer case mix index $ 3,937 $ 3,417 $202.23 1.2795 $ 3,392 $ 2,924 $141.97 1.1756 $ 2,972 $ 2,572 $111.53 1.0259 Efficiency Indicators FTEs per occupied bed Labor-hours per visit 4.59 4.68 4.15 5.84 3.77 8.66 Unit Cost Indicators Salary per FTES Employee benefits percentage Liability expense per discharge $24,447 19.58% $ 80.94 $22,517 17.04% $ 42.05 $20,347 15.18% $ 18.31 (Net inpatient revenu biNet outpatientre patient revenue - Inpatient expenses)/Total discharges outpatient revenue - Outpatient expenses)/Total visits Net inpatient revenue/Total discharges 6 Cases in Healthcare Finance ation's financial and operat- me stems from an automobile's rivers essential information ing condition. Thus, you plan to an five KPIs. One on financial performance, ratios to focus on operating more than a way to summarize an organization's financial an ing performance. Of course, the name stems from an dashboard, which contains gauges that give drivers essential inform about the car's performance and operating condition. Thus, you develop two dashboards, each containing no more than five KPI dashboard will use financial ratios to focus on financial perform while the other will use operating indicator ratios to focus on performance. You plan to present your recommendations for the tents of these dashboards, along with the rationale for the ratios ch! at the board meeting. Your ultimate goal is to replace the full fin and operating performance discussion at future board meetings will limited discussion of the KPIs. 2011 2012 2013 EXHIBIT 1.1 River Community Hospital: Statements of Operations (millions of dollars) Revenues Net patient service revenue Other revenue Total revenues $28.796 1.237 $30.033 $30.576 1.853 $32.429 $34.582 1.834 $36.416 Expenses Salaries and wages Fringe benefits Interest expense Depreciation Medical supplies and drugs Professional liability Other Total expenses $12.245 1.830 1.181 2.350 0.622 0.140 9.036 $27.404 $12.468 2.408 1.598 2.658 0.655 0.201 10.339 $30.327 $13.994 2.568 1.776 2.778 0.776 0.218 11.848 $33.958 Net Income $ 2.629 $ 2.102 $ 2.458 Case 1: Riverview Community Hospital (A) 7 2011 2012 2013 EXHIBIT 1.2 River Community Hospital: Balance Sheets (millions of dollars) $ 5.069 5.674 Assets Cash and investments Accounts receivable (net) Inventories Other current assets Total current assets Gross plant and equipment Accumulated depreciation Net plant and equipment Total assets $ 4.673 4.359 0.432 0.308 $ 9.772 $47.786 11.820 $35.966 $45.738 0.703 $11.969 $55.333 14.338 $40.995 $52.964 $ 2.795 7.413 0.601 0.923 $11.732 $59.552 17.009 $42.543 $54.275 Liabilities and Net Assets Accounts payable Accrued expenses Current portion of LT debt Total current liabilities Long-term debt Net assets Total liabilities and net assets $ 0.928 1.460 0.110 $ 2.498 15.673 27.567 $45.738 $ 1.253 1.503 1.341 $ 4.097 19.222 29.645 $52.964 $ 1.760 1.176 1.465 $ 4.401 17.795 32.079 $54.275 LT: long term 8 Cases in Healthcare Finance 2012 2013 EXHIBIT 1.3 River Community Hospital: Statements of Cash Flows (millions of dollars) Cash Flows from Operating Activities Net income Depreciation and noncash expenses Change in accounts receivable Change in inventories Change in other current assets Change in accounts payable Change in accrued expenses Net cash flow from operations $2.102 2.633 (1.315) (0.091) (0.395) 0.325 0.043 $3.302 $2.458 2.756 (1.739) (0.078) (0.220) 0.507 (0.327) $3.357 Cash Flows from Investing Activities Investment in plant and equipment ($7.686) ($4.328) $3.549 Cash Flows from Financing Activities Change in long-term debt Change in current portion of long-term debt Net cash flow from financing ($1.427) $1.231 $4.780 $0.124 ($1.303) Net increase (decrease) in cash $0.396 ($2.274 Beginning cash $4.673 $5.069 Ending cash $5.069 $2.795 Note: "Depreciation and noncash expenses" and "Investment in plant and equipment" data in the statements of cash flows are somewhat different than they would be it calculated directly from the other financial statements because of asset revaluations. Case 1: Riverview Community Hospital (A) 9 2011 2012 2013 Operating Revenue Gross inpatient service Gross outpatient service Gross patient service revenue $26.117 6.535 $32.652 EXHIBIT 1.4 River Community Hospital: Revenue and Expense Allocation millions of dollars) $29.148 9.130 $38.278 $33.216 11.912 $45.128 Contractual allowances Bad debt and charity care Total revenue deductions $ 1.729 2.127 $ 3.856 $ 5.196 2.506 $7.702 $ 7.516 3.030 $10.546 Net patient service revenue $28.796 $30.576 $34.582 Operating Expenses Inpatient service Outpatient service Total operating expenses $20.573 6.831 $27.404 $22.229 8.098 $30.327 $24.771 9.187 $33.958 2011 2012 2013 2,721 8,784 32,285 210 EXHIBIT 1.5 River Community Hospital: Selected Operating Data Medicare discharges Total discharges Outpatient visits Licensed beds Staffed beds Patient days All-payer case mix index Full-time equivalents 2,860 8,318 32,878 210 197 42,434 1.2993 625.8 2,741 8,576 36,796 210 178 40,062 1.3161 619.3 193 44,085 1.2869 610.8 10 Cases in Healthcare Finance +Quartile Median -Quartile EXHIBIT 1.6 B Selected Industry Financial Ratios (200-299 beds) Profitability Ratios Total margin Return on assets Return on equity Deductible ratio 5.58% 5.80% 15.66% 0.34 3.48% 3.10% 6.01% 0.26 0.53% 0.40% 0.62% 0.18 Liquidity Ratios Current ratio Days cash on hand 1.99 2.53 32.35 1.48 15.89 6.24 Debt Management Ratios Debt ratio Debt to equity ratio Times interest earned Cash flow coverage 62.90% 127.00% 4.29 48.40% 64.70% 2.23 3.22 35.20% 26.90% 1.14 1.76 5.32 2.20 1.04 1.76 0.89 1.49 0.75 Asset Management Ratios Fixed asset turnover Total asset turnover Days in patient accounts receivable Current asset turnover Average payment period (days) 87.53 3.94 71.24 75.67 3.38 63.33 2.88 45.84 Other Ratios Average age of plant (years) 8.86 7.39 6.14 "Deductions/Gross patient service revenue bTotal revenues/Current assets "Current liabilities/t(Total expenses - Depreciation expense)/365) Notes: 1. The industry data shown here are for illustrative purposes only and hence not be used outside this case. 2. The upper quartile is based on the higher numerical value for the ratio and quartile on the lower numerical value, regardless of whether a high value bad. The interpretation is left to the analyst. value for the ratio and the lower ether a high value is good or Case 1: Riverview Community Hospital (A) 11 +Quartile Median -Quartile Profit Indicators Profit per discharge Profit per visit EXHIBIT 1.7 2013 Selected Industry Operating Ratios (200-299 beds) $89.04 $ 6.22 ($21.30) $ 0.66 ($120.08) $ 7.01) $2,815 $ 98 Net Revenue Indicators Net revenue per discharge Net revenue per visita Medicare revenue percentage Bad debt/charity care percentage Contractual allowance percentage Outpatient revenue percentage $4,091 $ 201 43.47% 7.89% 25.27% 25.26% 31.25% $3,411 $ 139 36.60% 4.76% 20.02% 21.03% 2.97% 17.44% Volume Indicators Occupancy rate Average daily censusi 67.12% 173.23 58.10% 144.73 47.84% 114.39 Length-of-Stay Indicators Average length of stay (days) Adjusted length of stay' 6.80 6.48 6.07 5.36 5.41 4.52 Intensity-of-Service Indicators Expense per dischargem Adjusted expense per discharge Expense per visit All-payer case mix index $ 3,937 $ 3,417 $202.23 1.2795 $ 3,392 $ 2,924 $141.97 1.1756 $ 2,972 $ 2,572 $111.53 1.0259 Efficiency Indicators FTEs per occupied bed Labor-hours per visit 4.59 4.68 4.15 5.84 3.77 8.66 Unit Cost Indicators Salary per FTES Employee benefits percentage Liability expense per discharge $24,447 19.58% $ 80.94 $22,517 17.04% $ 42.05 $20,347 15.18% $ 18.31 (Net inpatient revenu biNet outpatientre patient revenue - Inpatient expenses)/Total discharges outpatient revenue - Outpatient expenses)/Total visits Net inpatient revenue/Total dischargesStep by Step Solution
There are 3 Steps involved in it
Step: 1

Get Instant Access to Expert-Tailored Solutions
See step-by-step solutions with expert insights and AI powered tools for academic success
Step: 2

Step: 3
Ace Your Homework with AI
Get the answers you need in no time with our AI-driven, step-by-step assistance
Get Started
Accountants Guidebook
Authors: Steven M. Bragg
5th Edition
1642211028, 978-1642211023