Question
1. Exhibit 2 of Linear Technology case provides Data on Linear Technologys Financials from 1992 to 2003, including Distributions to Shareholders. Based on this Information,
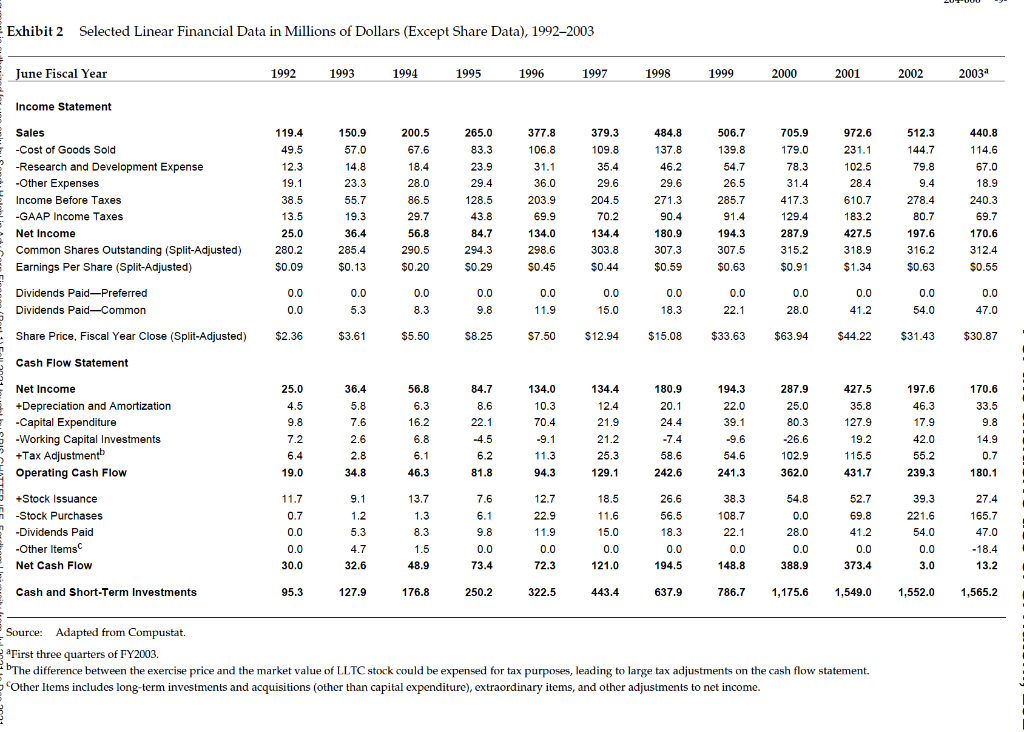 1. Exhibit 2 of Linear Technology case provides Data on Linear Technologys Financials from 1992 to 2003, including Distributions to Shareholders. Based on this Information, prepare a Spreadsheet with the Following Variables: Annual Payout Ratio Total Distribution to Shareholders (Dividends + Stock Repurchases New Stock Issue) as a Percentage of Sales, Operating Costs, and Net Cash-Flow to Shareholders Gross Profit Margin: (Sales CGS)/Sales Net Profit Margin: Net Income/Sales Capex + Net Working Capital Investment as a %age of Sales
2. Write a Commentary Summarizing these Computations and Highlighting Linear Technologys Current Payout Policy to its Historical Distribution Policy.
3. Exhibit 12 provides Data on Shareholder Distributions at Cisco, Intel, Maxim, and Microsoft for 1998 to 2012.
4. Compute the same ratios that you prepared for Linear Technology.
5. How Does Linear Technology Compare to these four Companies in terms of Dividends, Stock Repurchases, and New Stock Issues? Prepare a summary and possible Explanations for any differences.
Exhibit 2 Selected Linear Financial Data in Millions of Dollars (Except Share Data), 1992-2003 June Fiscal Year 1992 1993 1994 1995 1996 1997 1998 1999 2000 2001 2002 2003a Income Statement 150.9 57.0 200.5 67.6 506.7 139.8 54.7 26.5 512.3 144.7 79.8 9.4 Sales -Cost of Goods Sold -Research and Development Expense -Other Expenses Income Before Taxes -GAAP Income Taxes Net Income Common Shares Outstanding (Split-Adjusted) Earnings Per Share (Split-Adjusted) 119.4 49.5 12.3 19.1 38.5 13.5 25.0 280.2 $0.09 14.8 23.3 55.7 19.3 36.4 285.4 $0.13 18.4 28.0 86.5 29.7 56.8 290.5 $0.20 265.0 83.3 23.9 29.4 128.5 43.8 84.7 294.3 $0.29 377.8 106.8 31.1 36.0 203.9 69.9 134.0 298.6 $0.45 379.3 109.8 35.4 29.6 204.5 70.2 134.4 303.8 484.8 137.8 46.2 29.6 271.3 90.4 180.9 307.3 $0.59 705.9 179.0 78.3 31.4 417.3 129.4 287.9 315.2 $0.91 972.6 231.1 102.5 28.4 610.7 183.2 427.5 318.9 285.7 91.4 194.3 307.5 $0.63 278.4 80.7 197.6 316.2 $0.63 440.8 114.6 67.0 18.9 240.3 69.7 170.6 312.4 $0.55 $0.44 $1.34 0.0 0.0 0.0 Dividends Paid-Preferred Dividends Paid-Common 0.0 5.3 0.0 8.3 0.0 9.8 0.0 11.9 0.0 15.0 0.0 22.1 0.0 28.0 0.0 41.2 0.0 47.0 0.0 18.3 54.0 $2.36 $3.61 $5.50 $8.25 $7.50 $12.94 $15.08 $33.63 $63.94 $44.22 $31.43 $30.87 36.4 56.8 134.0 180.9 197.6 Share Price, Fiscal Year Close (Split-Adjusted) Cash Flow Statement Net Income +Depreciation and Amortization -Capital Expenditure -Working Capital Investments +Tax Adjustment Operating Cash Flow 25.0 4.5 84.7 8.6 5.8 6.3 10.3 70.4 46.3 194.3 22.0 39.1 20.1 24.4 9.8 7.6 16.2 17.9 134.4 12.4 21.9 21.2 25.3 129.1 287.9 25.0 80.3 -26.6 102.9 362.0 427.5 35.8 127.9 19.2 115.5 431.7 22.1 -4.5 6.2 170.6 33.5 9.8 14.9 0.7 180.1 2.6 7.2 6.4 6.8 6.1 46.3 2.8 34.8 -9.1 11.3 94.3 -7.4 58.6 242.6 -9.6 54.6 241.3 42.0 55.2 239.3 19.0 81.8 13.7 18.5 38.3 54.8 11.7 0.7 11.6 +Stock Issuance - Stock Purchases -Dividends Paid -Other Items Net Cash Flow 9.1 1.2 5.3 4.7 32.6 1.3 8.3 7.6 6.1 9.8 0.0 73.4 12.7 22.9 11.9 0.0 72.3 26.6 56.5 18.3 0.0 0.0 0.0 30.0 0.0 28.0 108.7 22.1 0.0 39.3 221.6 54.0 52.7 69.8 41.2 0.0 373.4 15.0 0.0 121.0 27.4 165.7 47.0 -18.4 13.2 1.5 0.0 388.9 0.0 3.0 48.9 194.5 148.8 Cash and Short-Term Investments - 95.3 127.9 176.8 250.2 322.5 443.4 637.9 786.7 1,175.6 1,549.0 1,552.0 1,565.2 Source: Adapted from Compustat. First three quarters of FY2003. The difference between the exercise price and the market value of LLTC stock could be expensed for tax purposes, leading to large tax adjustments on the cash flow statement. Other Items includes long-term investments and acquisitions (other than capital expenditure), extraordinary items, and other adjustments to net income. Exhibit 2 Selected Linear Financial Data in Millions of Dollars (Except Share Data), 1992-2003 June Fiscal Year 1992 1993 1994 1995 1996 1997 1998 1999 2000 2001 2002 2003a Income Statement 150.9 57.0 200.5 67.6 506.7 139.8 54.7 26.5 512.3 144.7 79.8 9.4 Sales -Cost of Goods Sold -Research and Development Expense -Other Expenses Income Before Taxes -GAAP Income Taxes Net Income Common Shares Outstanding (Split-Adjusted) Earnings Per Share (Split-Adjusted) 119.4 49.5 12.3 19.1 38.5 13.5 25.0 280.2 $0.09 14.8 23.3 55.7 19.3 36.4 285.4 $0.13 18.4 28.0 86.5 29.7 56.8 290.5 $0.20 265.0 83.3 23.9 29.4 128.5 43.8 84.7 294.3 $0.29 377.8 106.8 31.1 36.0 203.9 69.9 134.0 298.6 $0.45 379.3 109.8 35.4 29.6 204.5 70.2 134.4 303.8 484.8 137.8 46.2 29.6 271.3 90.4 180.9 307.3 $0.59 705.9 179.0 78.3 31.4 417.3 129.4 287.9 315.2 $0.91 972.6 231.1 102.5 28.4 610.7 183.2 427.5 318.9 285.7 91.4 194.3 307.5 $0.63 278.4 80.7 197.6 316.2 $0.63 440.8 114.6 67.0 18.9 240.3 69.7 170.6 312.4 $0.55 $0.44 $1.34 0.0 0.0 0.0 Dividends Paid-Preferred Dividends Paid-Common 0.0 5.3 0.0 8.3 0.0 9.8 0.0 11.9 0.0 15.0 0.0 22.1 0.0 28.0 0.0 41.2 0.0 47.0 0.0 18.3 54.0 $2.36 $3.61 $5.50 $8.25 $7.50 $12.94 $15.08 $33.63 $63.94 $44.22 $31.43 $30.87 36.4 56.8 134.0 180.9 197.6 Share Price, Fiscal Year Close (Split-Adjusted) Cash Flow Statement Net Income +Depreciation and Amortization -Capital Expenditure -Working Capital Investments +Tax Adjustment Operating Cash Flow 25.0 4.5 84.7 8.6 5.8 6.3 10.3 70.4 46.3 194.3 22.0 39.1 20.1 24.4 9.8 7.6 16.2 17.9 134.4 12.4 21.9 21.2 25.3 129.1 287.9 25.0 80.3 -26.6 102.9 362.0 427.5 35.8 127.9 19.2 115.5 431.7 22.1 -4.5 6.2 170.6 33.5 9.8 14.9 0.7 180.1 2.6 7.2 6.4 6.8 6.1 46.3 2.8 34.8 -9.1 11.3 94.3 -7.4 58.6 242.6 -9.6 54.6 241.3 42.0 55.2 239.3 19.0 81.8 13.7 18.5 38.3 54.8 11.7 0.7 11.6 +Stock Issuance - Stock Purchases -Dividends Paid -Other Items Net Cash Flow 9.1 1.2 5.3 4.7 32.6 1.3 8.3 7.6 6.1 9.8 0.0 73.4 12.7 22.9 11.9 0.0 72.3 26.6 56.5 18.3 0.0 0.0 0.0 30.0 0.0 28.0 108.7 22.1 0.0 39.3 221.6 54.0 52.7 69.8 41.2 0.0 373.4 15.0 0.0 121.0 27.4 165.7 47.0 -18.4 13.2 1.5 0.0 388.9 0.0 3.0 48.9 194.5 148.8 Cash and Short-Term Investments - 95.3 127.9 176.8 250.2 322.5 443.4 637.9 786.7 1,175.6 1,549.0 1,552.0 1,565.2 Source: Adapted from Compustat. First three quarters of FY2003. The difference between the exercise price and the market value of LLTC stock could be expensed for tax purposes, leading to large tax adjustments on the cash flow statement. Other Items includes long-term investments and acquisitions (other than capital expenditure), extraordinary items, and other adjustments to net incomeStep by Step Solution
There are 3 Steps involved in it
Step: 1

Get Instant Access to Expert-Tailored Solutions
See step-by-step solutions with expert insights and AI powered tools for academic success
Step: 2

Step: 3
Ace Your Homework with AI
Get the answers you need in no time with our AI-driven, step-by-step assistance
Get Started