

Answered step by step
Verified Expert Solution
Question
1 Approved Answer
1. Explain how bar charts and activity network diagrams provide different views of a project's schedule and tasks. 2. Describe the Critical Path Method (CPM)/Critical
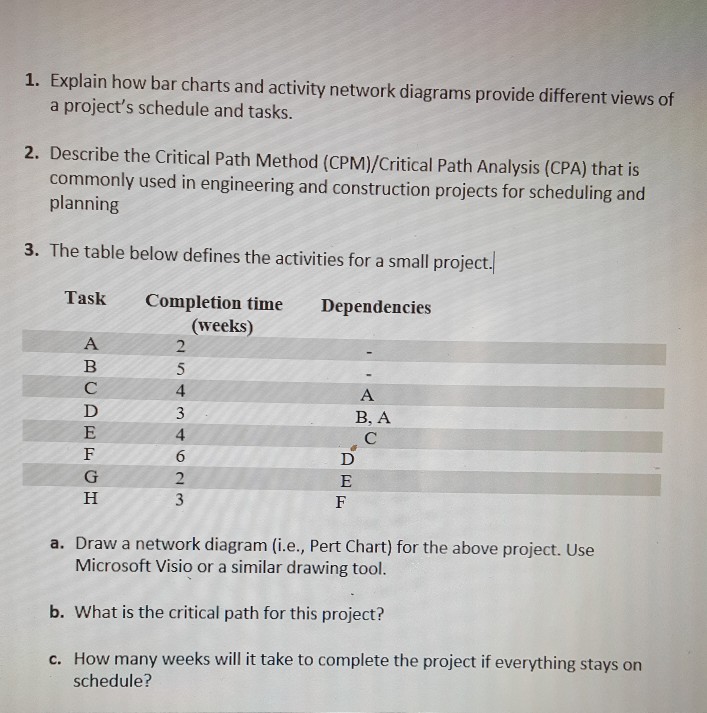
1. Explain how bar charts and activity network diagrams provide different views of a project's schedule and tasks. 2. Describe the Critical Path Method (CPM)/Critical Path Analysis (CPA) that is commonly used in engineering and construction projects for scheduling and planning 3. The table below defines the activities for a small project Task Completion time Dependencies (weeks) B. A a. Draw a network diagram (i.e., Pert Chart) for the above project. Use Microsoft Visio or a similar drawing tool. b. What is the critical path for this project? c. How many weeks will it take to complete the project if everything stays on schedule
Step by Step Solution
There are 3 Steps involved in it
Step: 1

Get Instant Access to Expert-Tailored Solutions
See step-by-step solutions with expert insights and AI powered tools for academic success
Step: 2

Step: 3
Ace Your Homework with AI
Get the answers you need in no time with our AI-driven, step-by-step assistance
Get Started
The Database Experts Guide To Database 2
Authors: Bruce L. Larson
1st Edition
0070232679, 978-0070232679