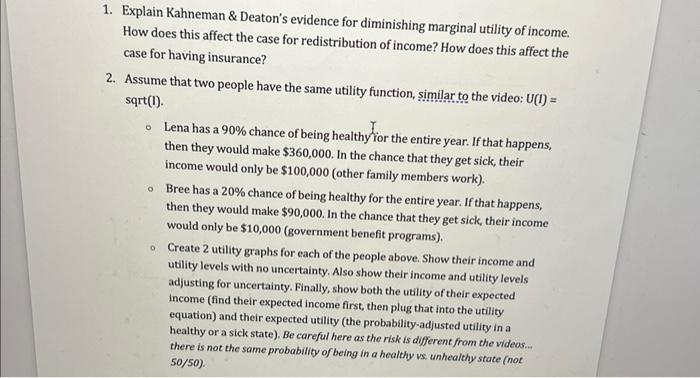
1. Explain Kahneman \& Deaton's evidence for diminishing marginal utility of income. How does this affect the case for redistribution of income? How does this affect the case for having insurance? 2. Assume that two people have the same utility function, similarto the video: U(I)= sqrt(I). - Lena has a 90% chance of being healthy ior the entire year. If that happens, then they would make $360,000. In the chance that they get sick, their income would only be $100,000 (other family members work). - Bree has a 20% chance of being healthy for the entire year. If that happens, then they would make $90,000. In the chance that they get sick, their income would only be $10,000 (government benefit programs). - Create 2 utility graphs for each of the people above. Show their income and utility levels with no uncertainty. Also show their income and utility levels adjusting for uncertainty. Finally, show both the utility of their expected income (find their expected income first, then plug that into the utility equation) and their expected utility (the probability-adjusted utility in a healthy or a sick state). Be careful here as the risk is different from the videos... there is not the same probability of being in a healthy ve unhealthy state (not) 50/50 ). 1. Explain Kahneman \& Deaton's evidence for diminishing marginal utility of income. How does this affect the case for redistribution of income? How does this affect the case for having insurance? 2. Assume that two people have the same utility function, similarto the video: U(I)= sqrt(I). - Lena has a 90% chance of being healthy ior the entire year. If that happens, then they would make $360,000. In the chance that they get sick, their income would only be $100,000 (other family members work). - Bree has a 20% chance of being healthy for the entire year. If that happens, then they would make $90,000. In the chance that they get sick, their income would only be $10,000 (government benefit programs). - Create 2 utility graphs for each of the people above. Show their income and utility levels with no uncertainty. Also show their income and utility levels adjusting for uncertainty. Finally, show both the utility of their expected income (find their expected income first, then plug that into the utility equation) and their expected utility (the probability-adjusted utility in a healthy or a sick state). Be careful here as the risk is different from the videos... there is not the same probability of being in a healthy ve unhealthy state (not) 50/50 )


