

Question
1. Exploring Finance: Cost of Capital Comparison Conceptual Overview: Explore how the timing and size of cash flows affect the net present values of two
1. Exploring Finance: Cost of Capital Comparison
Conceptual Overview: Explore how the timing and size of cash flows affect the net present values of two alternative investments.
The blue curve (labeled "L") depicts the NPV for a project with larger cash flows later of -$1,000, $100, $300, $400, and $675. The red curve (labeled "S") depicts the NPV for a project with larger cash flows sooner of -$1,000, $500, $400, $300, and $100. Drag on the graph either left or right to change the cost of capital interest rate at which the NPV is evaluated for the two projects.
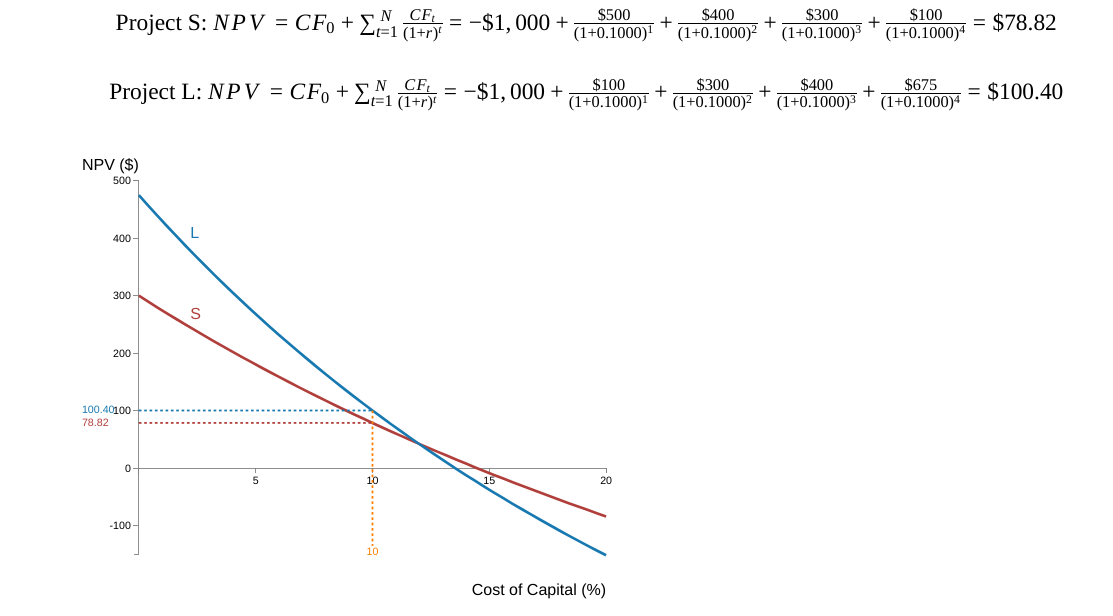
| 1. What is the approximate cost of capital for which the two cash flows are about equal?
-Select-abcdItem 1 2. What is the approximate internal rate of return (IRR) for the Project L cash flow?
-Select-abcdItem 2 3. What is the approximate internal rate of return (IRR) for the Project S cash flow?
-Select-abcdItem 3 4. What is the name for the point at which the two projects' NPVs are equal?
-Select-abcdItem 4 5. At a cost of capital less than the point at which they cross, which project will have the higher NPV?
-Select-abcdItem 5 6. At a cost of capital greater than the point at which they cross, which project will have the higher NPV?
-Select-abcdItem 6 7. The internal rate of return (IRR) is the point at which a project's NPV equals 0. If the cost of capital were 5% (move the slider so that is the case), then
-Select-abcItem 7 8. If the cost of capital was greater than the point at which the two projected NPVs are equal, then
|
Step by Step Solution
There are 3 Steps involved in it
Step: 1

Get Instant Access to Expert-Tailored Solutions
See step-by-step solutions with expert insights and AI powered tools for academic success
Step: 2

Step: 3
Ace Your Homework with AI
Get the answers you need in no time with our AI-driven, step-by-step assistance
Get Started
Lords Of Finance The Bankers Who Broke The World
Authors: Liaquat Ahamed
1st Edition
0143116800, 978-0143116806